#StandWithUkraine - Stop the Russian invasion
Join us and donate. Since 2022 we have contributed over $5,000 in book royalties to Save Life in Ukraine & Ukraine Humanitarian Appeal & The HALO Trust, and we will continue to give!
Locator Point Map with Datawrapper
We first introduced you to the free and easy-to-learn Datawrapper tool in Chapter 6: Chart Your Data. This tool also offers powerful features to create different types of maps, with professional-looking design elements. With Datawrapper you can start to work right away in your browser, with no account required unless you wish to save and share your work online.
Locator point maps are best used to introduce readers to key landmarks, and associated polygon regions, to provide a frame of reference for a geographic area. The Locator Map tool in Datawrapper easily allows you to display points with a selection of colored markers and show their proximity to preset list of polygon areas. More advanced users can upload their own custom polygons or lines in GeoJSON format, a concept we explain in Chapter 13: Transform Your Map Data.
In this section, you’ll learn how to create a Locator Map in Datawrapper to highlight key landmarks (points) inside a city boundary (a polygon), then publish and share your interactive map, as shown in Figure 7.15.
Figure 7.15: Locator map with Datawrapper: Popular locations in San Francisco, California. Explore the interactive version.
- Open Datawrapper, click on Start Creating, then the New Map button, and select Locator map, as shown in Figure 7.16.
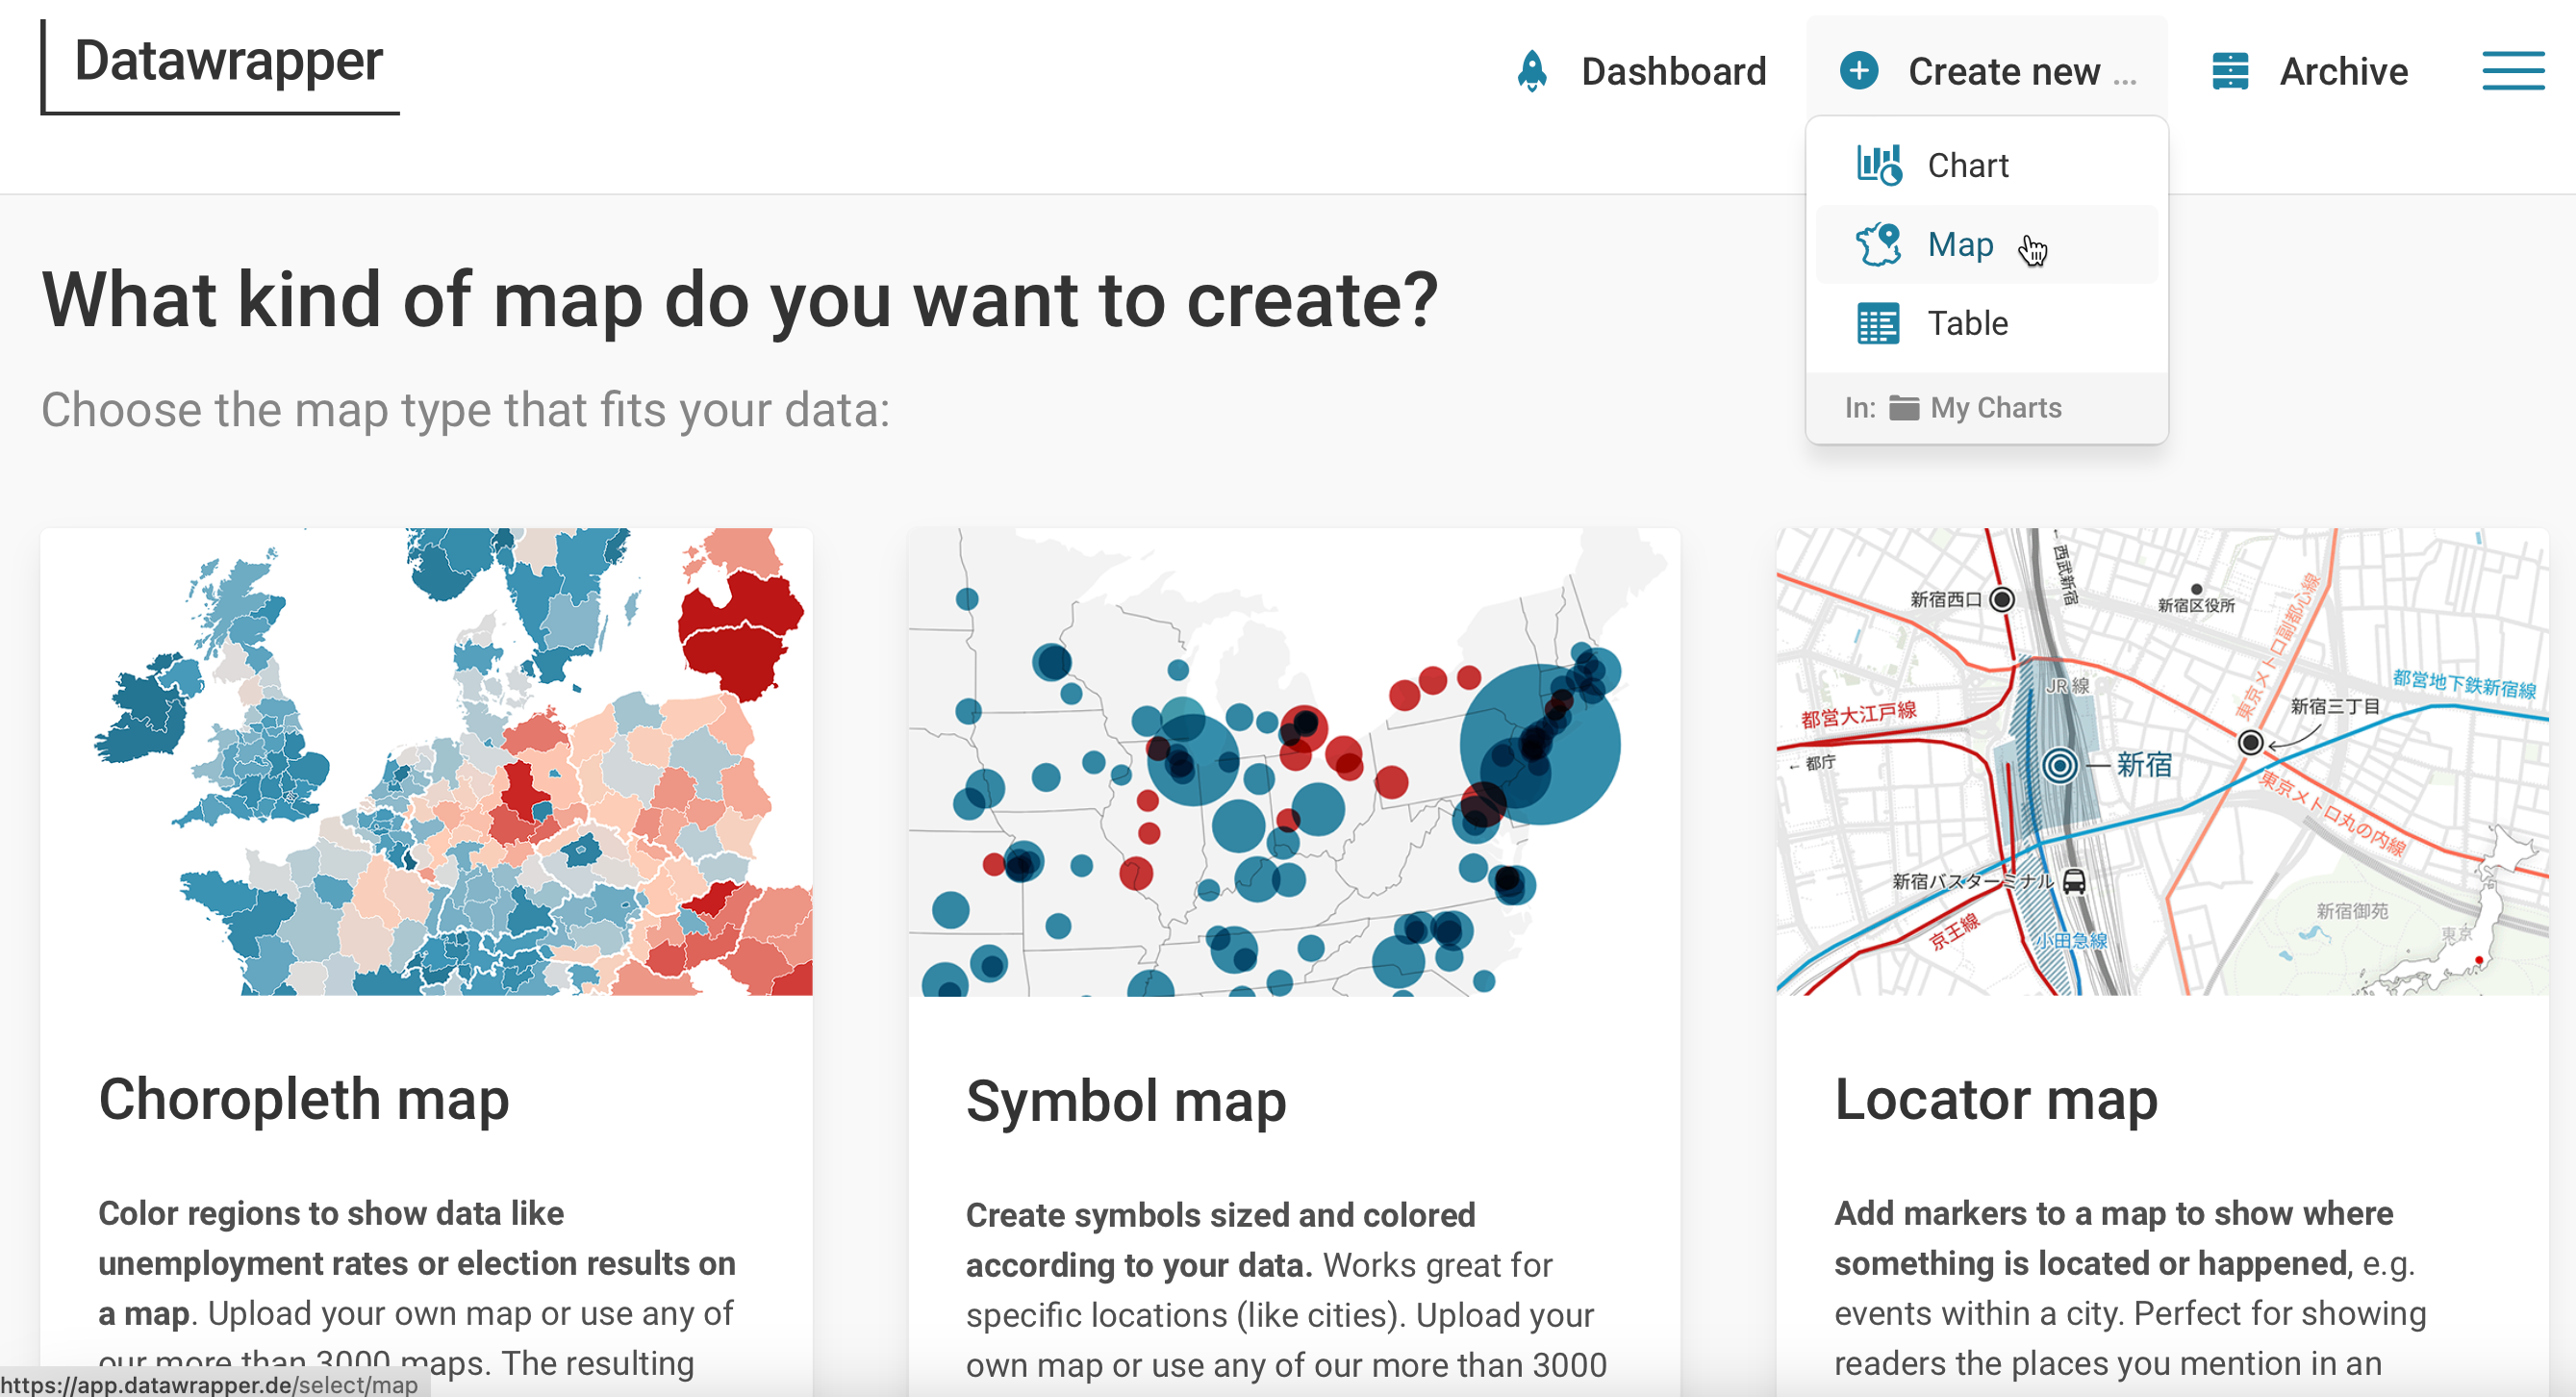
Figure 7.16: Start creating a New Map and select Locator map
- Add point markers to your map by entering the name of a place, or an address, or paste a Google Maps link, as shown in Figure 7.17.
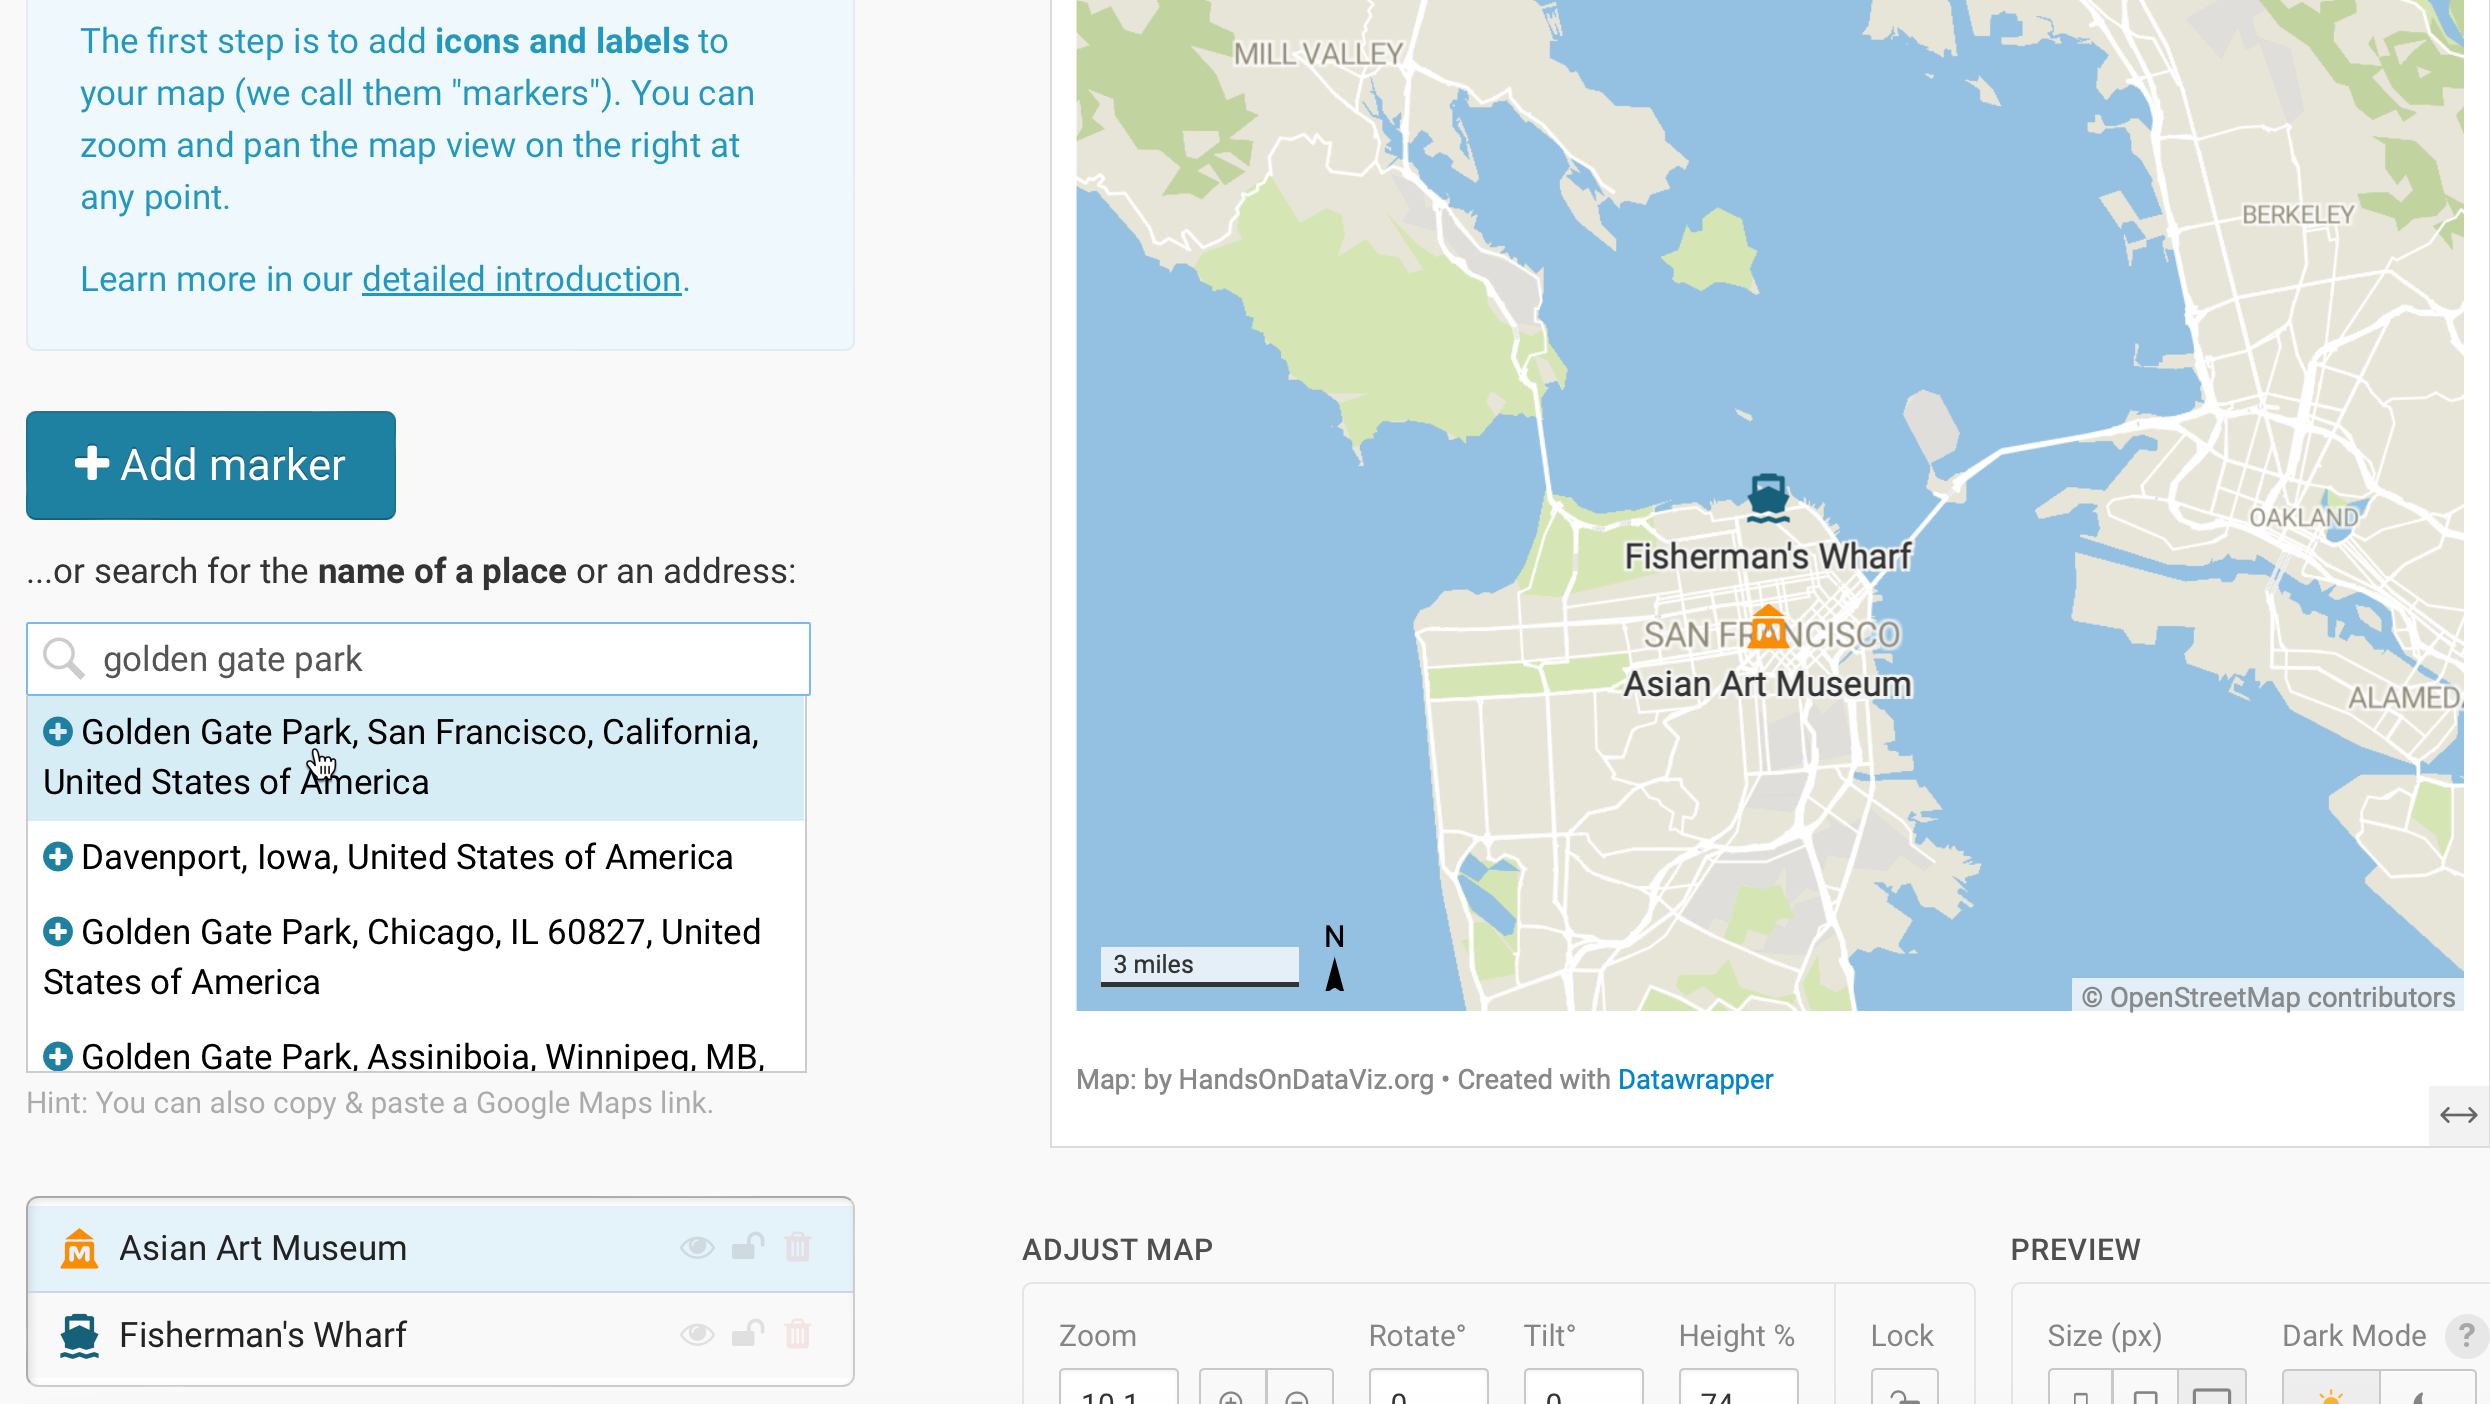
Figure 7.17: Add point markers by entering a place, address, or pasting a Google Maps link.
- Select a point marker to edit the text, choose a preset number or symbol or color, or add an interactive tooltip, as shown in Figure 7.18.
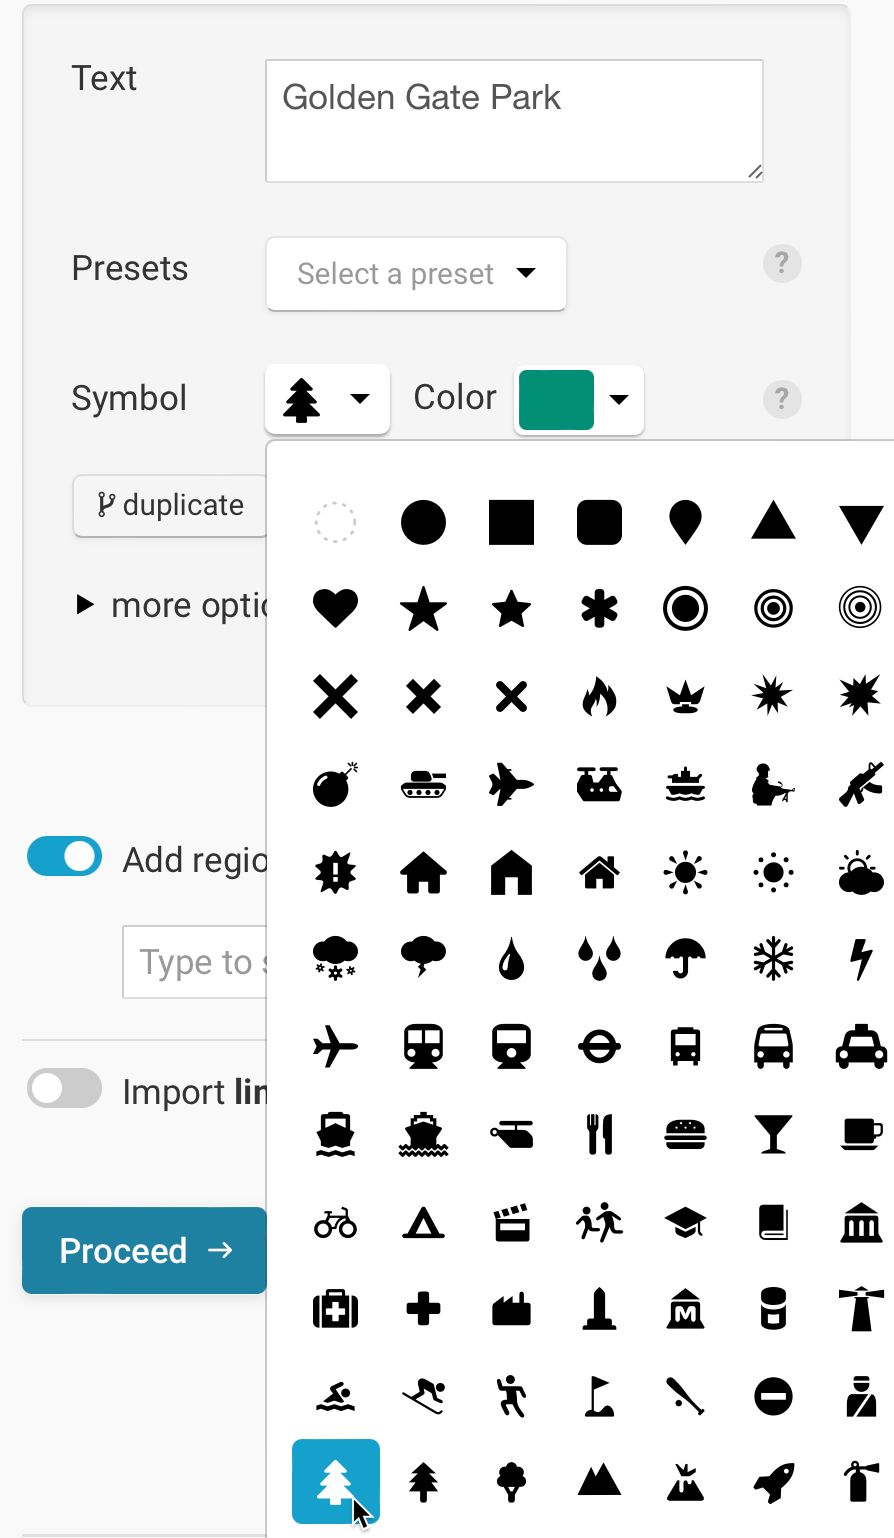
Figure 7.18: Edit point markers by choosing preset numbers, symbols, colors, or adding interactive tooltips.
- To add a basic polygon (such as a preset city or regional boundary), scroll down to turn on Add region as area marker, select a listed area, and modify the appearance of its fill or outline color, as shown in Figure 7.19.
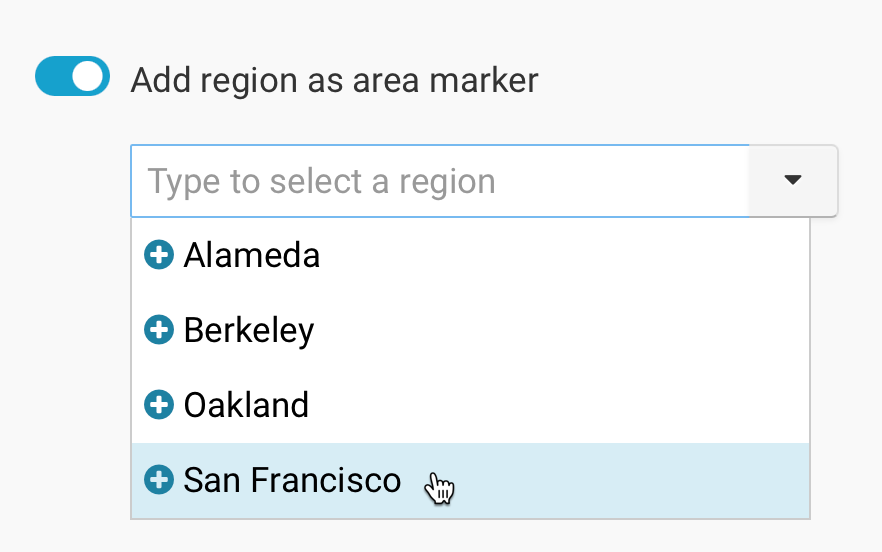
Figure 7.19: Caption here…
- Adjust the zoom and center of your map, and preview how it will look on different sized devices, such as smaller smartphones or larger desktops, as shown in Figure 7.20.
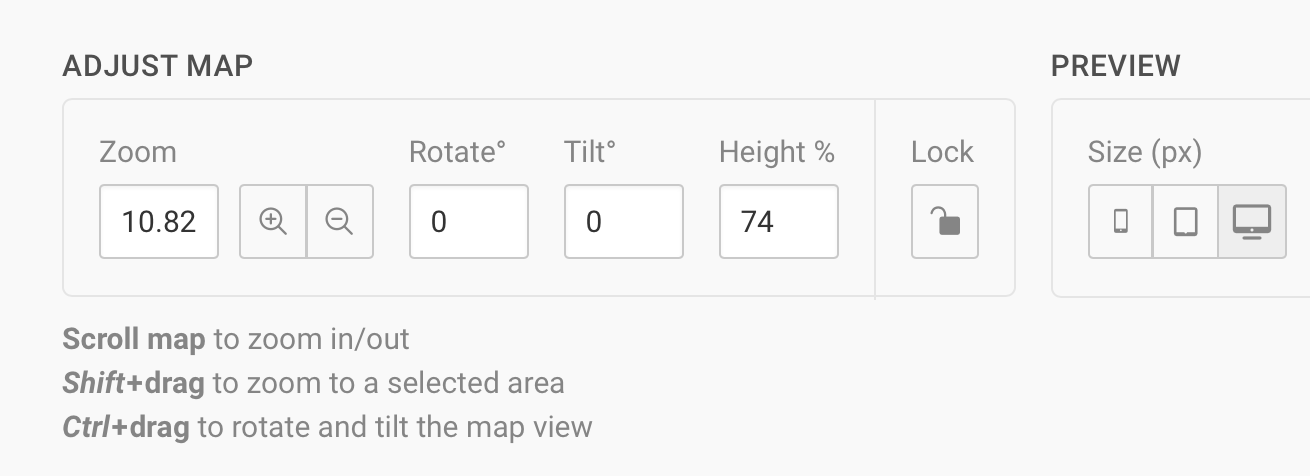
Figure 7.20: Adjust your map zoom level and center it, and preview how it will appear on small and large screens.
Proceed to the Design Map tab to select background map styles and labelling, and choose to add map extras, such as scale bar, north arrow, or inset map.
Proceed to the Annotate & Layout tab to insert a title, byline, or marker key.
Proceed to the Publish & Embed tab to share your map link or embed it on a web page. Also, scroll down on this tab to Export your visualization as a static PNG image, or export the spatial geography in GeoJSON format for other visualization tools, as shown in Figure 7.21.
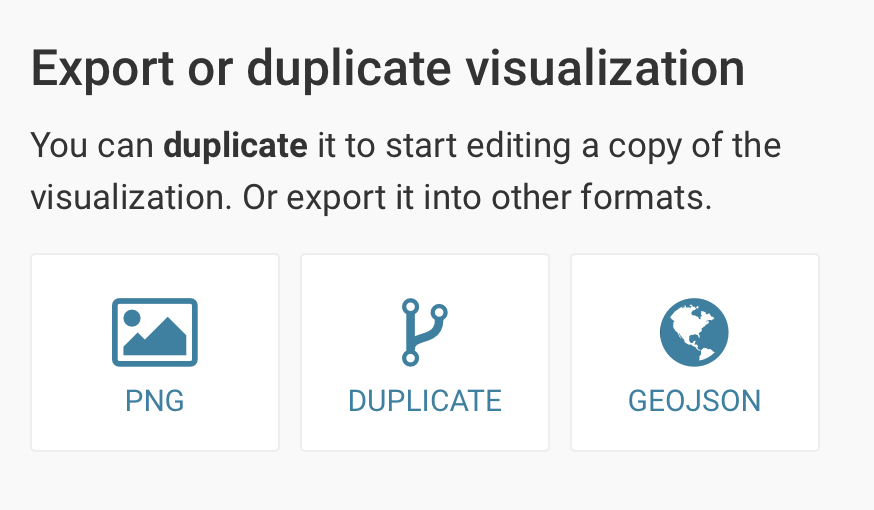
Figure 7.21: After publishing your live interactive map, you also can export a static PNG image or GeoJSON spatial data file.
Datawrapper’s Locator Map offers an easy introduction to highlighting some key points on a map and showing their relationship to an outlined region. To learn more steps beyond this basic tutorial, see more detailed instructions by How to Create a Locator Map by Datawrapper Academy.
In the next section, we’ll explore how to create point maps with more features, such as markers in grouped categories or with custom images, using Google My Maps. The tool is similar to Datawrapper’s Locator point map, but offers different options and flexiblity.