#StandWithUkraine - Stop the Russian invasion
Join us and donate. Since 2022 we have contributed over $5,000 in book royalties to Save Life in Ukraine & Ukraine Humanitarian Appeal & The HALO Trust, and we will continue to give!
Spreadsheet vs. Relational Database
In the previous section, you learned how the XLOOKUP function can search for matching data in columns across spreadsheets and automatically paste results. Building on that concept, let’s distinguish between a spreadsheet and a relational database, and under what circumstances it might be wiser to use the latter.
A spreadsheet is sometimes called a “flat-file database” because all of the records are stored in rows and columns in a single table. For example, if you kept a single spreadsheet of US food bank staff, every row would list an individual person, organization, and addresses, just like the mailing list we created in Figure 2.39 in the prior section on XLOOKUP.
But keeping all of your data in a single spreadsheet can raise problems. For example, it contains lots of duplicated entries. For people who all work at the same food bank, each row contains a duplicate of that organization’s address. If an organization moves to a new location, you need to update all of the rows that contain those addresses. Or if two organizations merge together under a new name, you need to update all of the rows for individuals affected by that change. While keeping all of your information organized in a single spreadsheet initially sounds like a good idea, when your dataset grows in size and internal relationships (such as tracking people who are connected to organizations, etc.), continually updating every row becomes a lot of extra work.
Instead of a single spreadsheet, consider using a relational database, which organizes information into separate sheets (also known as tables), but continually maintains the relevant connections between them. Look back at the two-sheet problem we presented in Figure 2.35 at the beginning of the XLOOKUP section. The first sheet lists individual people at each food bank, the second sheet lists the address for each food bank, and the two sheets share a column named organization that shows how they are related. Relational databases can save you time. For example, if you update an organization’s address in one sheet, the linked sheet will automatically reflect this change in every row for staff who work at that organization.
Although Google Sheets is a great spreadsheet, it’s not a relational database. Instead, consider a better tool such as Airtable, which allows you to create relational databases in your web browser with up to 1,200 free records (or more with the paid version), using existing templates or your own designs. Airtable enables data migration by importing or exporting all records in CSV format, and it also supports real-time editor collaboration with co-workers.
To demonstrate, we imported both of the Google Sheets above into this live Airtable database called Food Banks sample, which anyone with the link can view, but only we can edit. At the top are tabs to view each sheet, named people and food banks. To transform this into a relational database, we used Airtable settings to link the organization column in the people sheet to the food banks sheet, where the addresses are stored, as shown in Figure 2.40. In our editable version, we double-clicked on the column name, then selected Link to another record in the drop-down menu, to connect it to another tab.
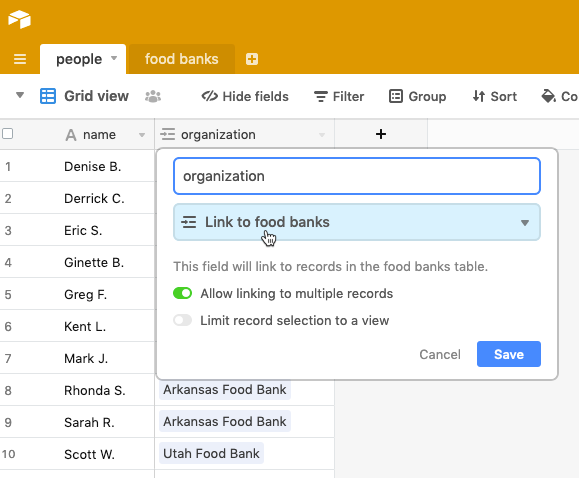
Figure 2.40: In this Airtable sample, we linked the organization column in the people sheet to the food banks sheet.
In our Airtable sample, click on a linked row to expand it and view related data. For example, if you click and expand on the first row the people sheet, their organization’s full address appears from the food banks sheet, as shown in Figure 2.41. In our editable version, if we update the address for one organization in the food banks sheet, it’s automatically changed for all employees linked to that organization in the people sheet. In addition, Airtable allows you to sort, filter, and create different views of your data that you can share with others, a topic we’ll cover in Chapter 9: Embed on the Web. See more about its features in the Airtable Support page.
Figure 2.41: In this Airtable demo, click on a row in one sheet to expand and view its linked data in another sheet.
It’s important to understand the conceptual differences between a “flat-file” spreadsheet and a relational database to help you determine when to use one tool versus another. As you’ve learned in the sections above, spreadsheets are your best choice to begin organizing and analyzing your data, using methods such as sorting, filtering, pivoting, and lookup, to help reveal the underlying stories that you may wish to visualize. But relational databases are your best choice when maintaining large amounts of data with internal links, like one-to-many relationships, such as an organization with several employees.
Summary
If you’re one of the many people who “never really learned” about spreadsheets in school or on the job, or if you’ve taught yourself bits and pieces along the way, we hope that this chapter has successfully strengthened your skills. All of the subsequent chapters in this book, especially those on designing interactive charts in Chapter 6 and interactive maps in Chapter 7, require a basic level of familiarity with spreadsheets. In addition to serving as incredible time-savers when it comes to tedious data tasks, the spreadsheet tools and methods featured above are designed to help you share, sort, calculate, pivot, and lookup matching data, with the broader goal of visualizing your data stories.
The next chapter describes strategies for finding and questioning your data, particularly on open data sites operated by governmental and non-profit organizations, where you’ll also need spreadsheet skills to download and organize public information.