#StandWithUkraine - Stop the Russian invasion
Join us and donate. Since 2022 we have contributed over $5,000 in book royalties to Save Life in Ukraine & Ukraine Humanitarian Appeal & The HALO Trust, and we will continue to give!
Geospatial Data and GeoJSON
Let’s talk about basics of geospatial data to help you to better understand the map layers that you’ll create and edit later in this chapter. The first thing to know about geospatial data is that it consists of two components, location and attribute.
When you use Google Maps to search for a restaurant, you see a red marker on the screen that points to its location in latitude and longitude coordinates, such as 41.7620891, -72.6856295. Attributes include additional information such as the restaurant name, its human-friendly street address, and guest review comments. All of these attributes add value to your location data.
Second, geospatial data can be raster or vector, a concept we previously introduced in the Map Design Principles section of Chapter 7. In digital maps, raster data often appears as satellite and aerial images, and the quality depends on the resolution of the camera that captured them. If a satellite camera has a 1-meter resolution, its images display the different colors it captured as a grid of cells, which measure one meter on each side. Each of these cells appears as a color-coded pixel on our computer screens. If you zoom in too close to a raster image, it may appear fuzzy or pixelated due to the resolution limitations of the original image, as shown in Figure 13.1.
By contrast, vector data often appears in digital maps as pictorial images of buildings, rivers, and regions. Vector maps can be created by humans or algorithms when they draw points, polylines, and polygons from raster satellite or aerial images, or from devices such as GPS trackers that record runs or hikes, or from other sources. For example, much of OpenStreetMap has been built by volunteers who trace outlines of objects from satellite images, and anyone can sign up to help expand it this crowdsourced map of the world. Unlike raster maps, vector maps remain sharply focused at any zoom level, because every point and line is represented by latitude and longitude coordinates, which can be expressed with precise decimals. In addition, while raster data is generally limited to one value per cell (such as color for traditional satellite images, or height above sea level for digital elevation models), vector data can contain multiple attributes about each object (such as its name, street address, and comments). Moreover, vector map files tend to be smaller in size than raster ones, which is important when we create and upload maps to share and display online.
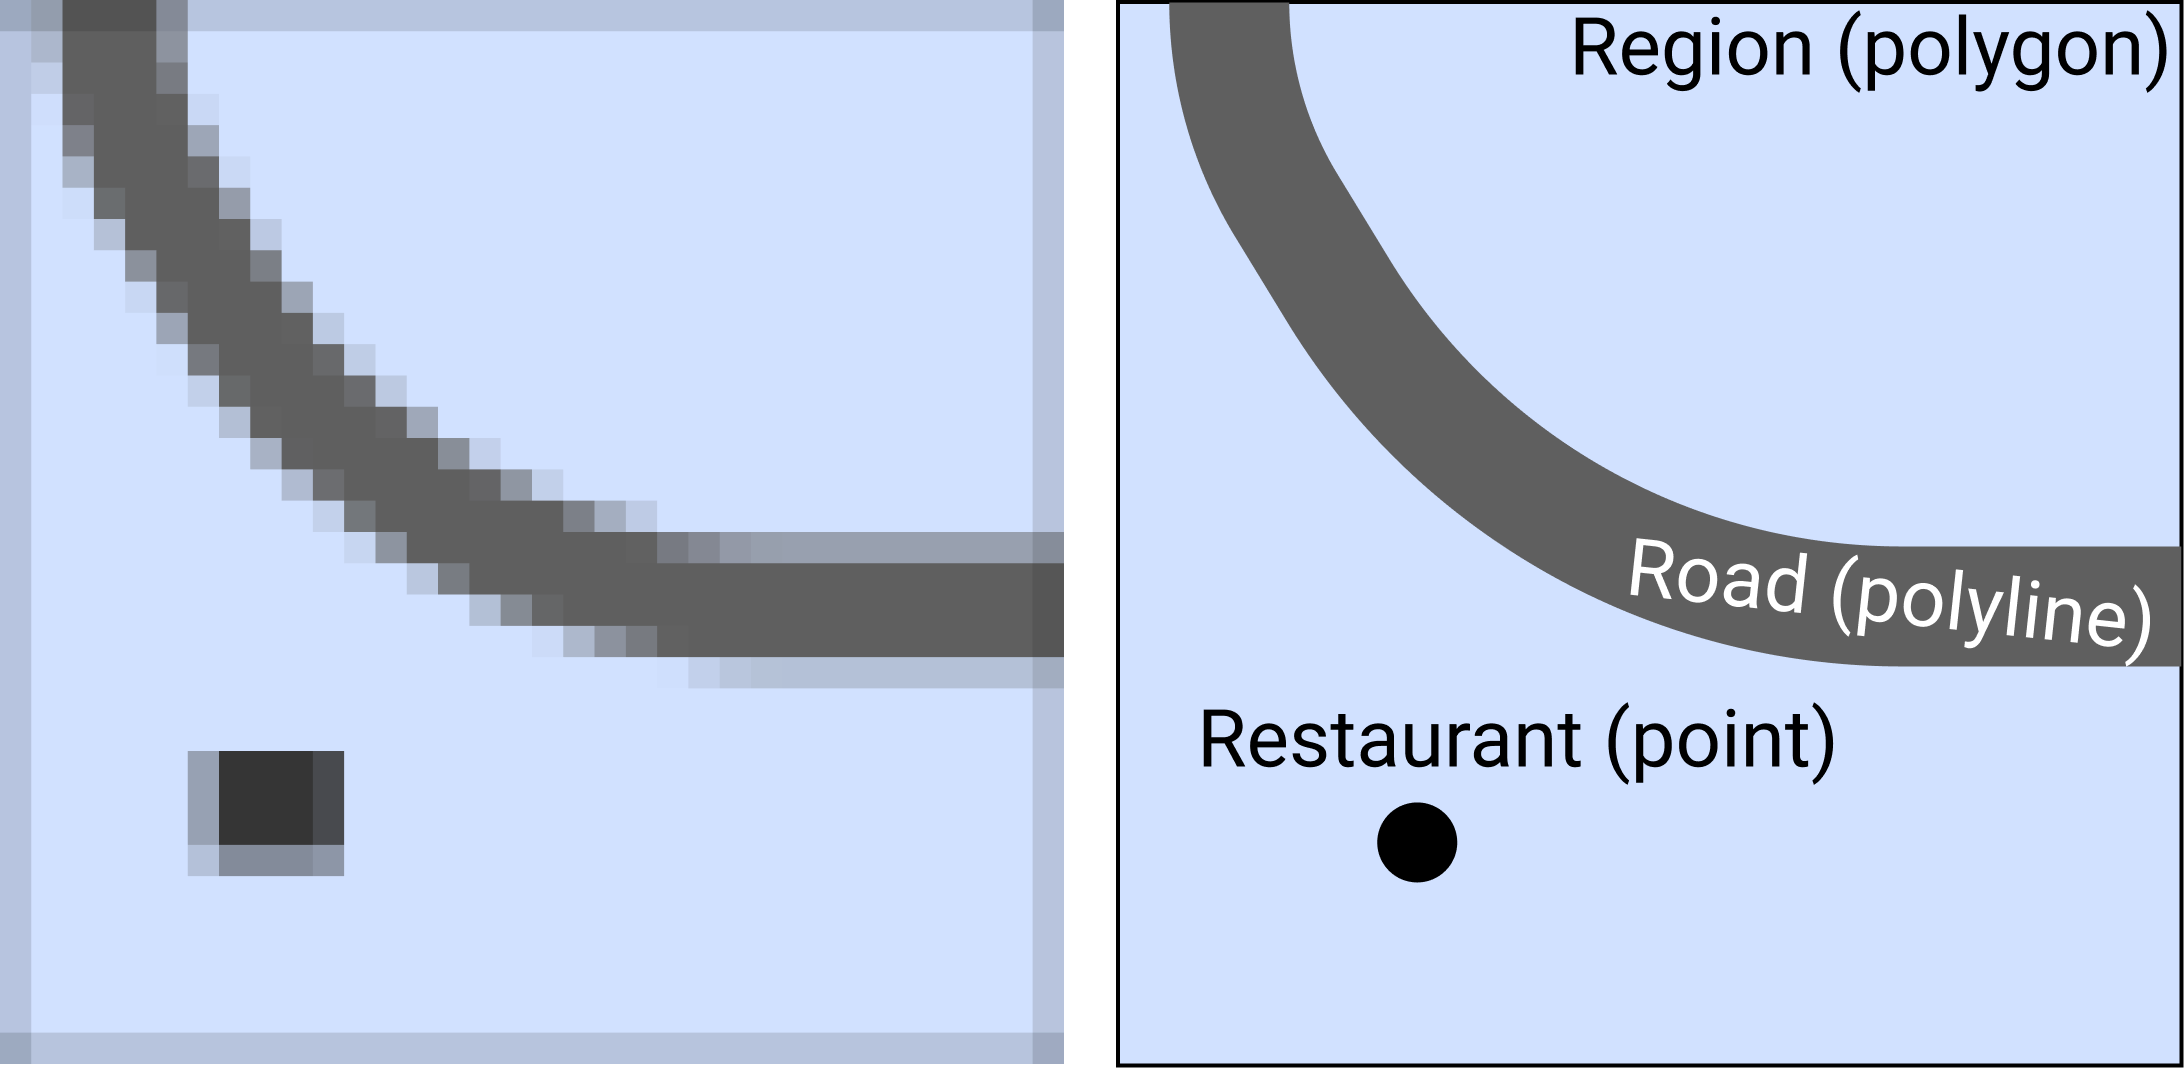
Figure 13.1: Geospatial data can be a raster grid of cells (on the left) or a vector collection of points, polylines, and polygons (on the right).
Since we focus on vector data in the several sections of this chapter, let’s take a look at some of its most common file formats, starting with GeoJSON, the format that works best with our recommended tools.
GeoJSON
GeoJSON is a popular map data format, based on an open-standard created in 2016, with file extensions that end with .geojson or .json. The code snippet below represents a single point in GeoJSON format, with latitude of 41.76 and longitude of -72.67, and a name attribute (also known as a property) whose value is Hartford.
{
  "type": "Feature",
  "geometry": {
    "type": "Point",
    "coordinates": [-72.67, 41.76]
  },
  "properties": {
    "name": "Hartford"
  }
}
In addition to Point feature type shown above, other GeoJSON types can be LineString (also known as lines or polylines) or Polygon, both of which are represented as arrays of points. The simplicity and readability of GeoJSON allows you to edit it even in the most
simple text editor, such as the Pulsar Editor tool described in Chapter 10.
We strongly recommend that you create and edit map data in GeoJSON format, which is supported by the map tools we recommend in this book (such as Datawrapper and Leaflet) and dozens of others. Storing and sharing your geospatial data in GeoJSON ensures that you can others will be able to use the file without installing bulky or expensive GIS desktop applications. Another benefit is that your GitHub repository will automatically display a map preview of any GeoJSON file, as shown in Figure 13.2.
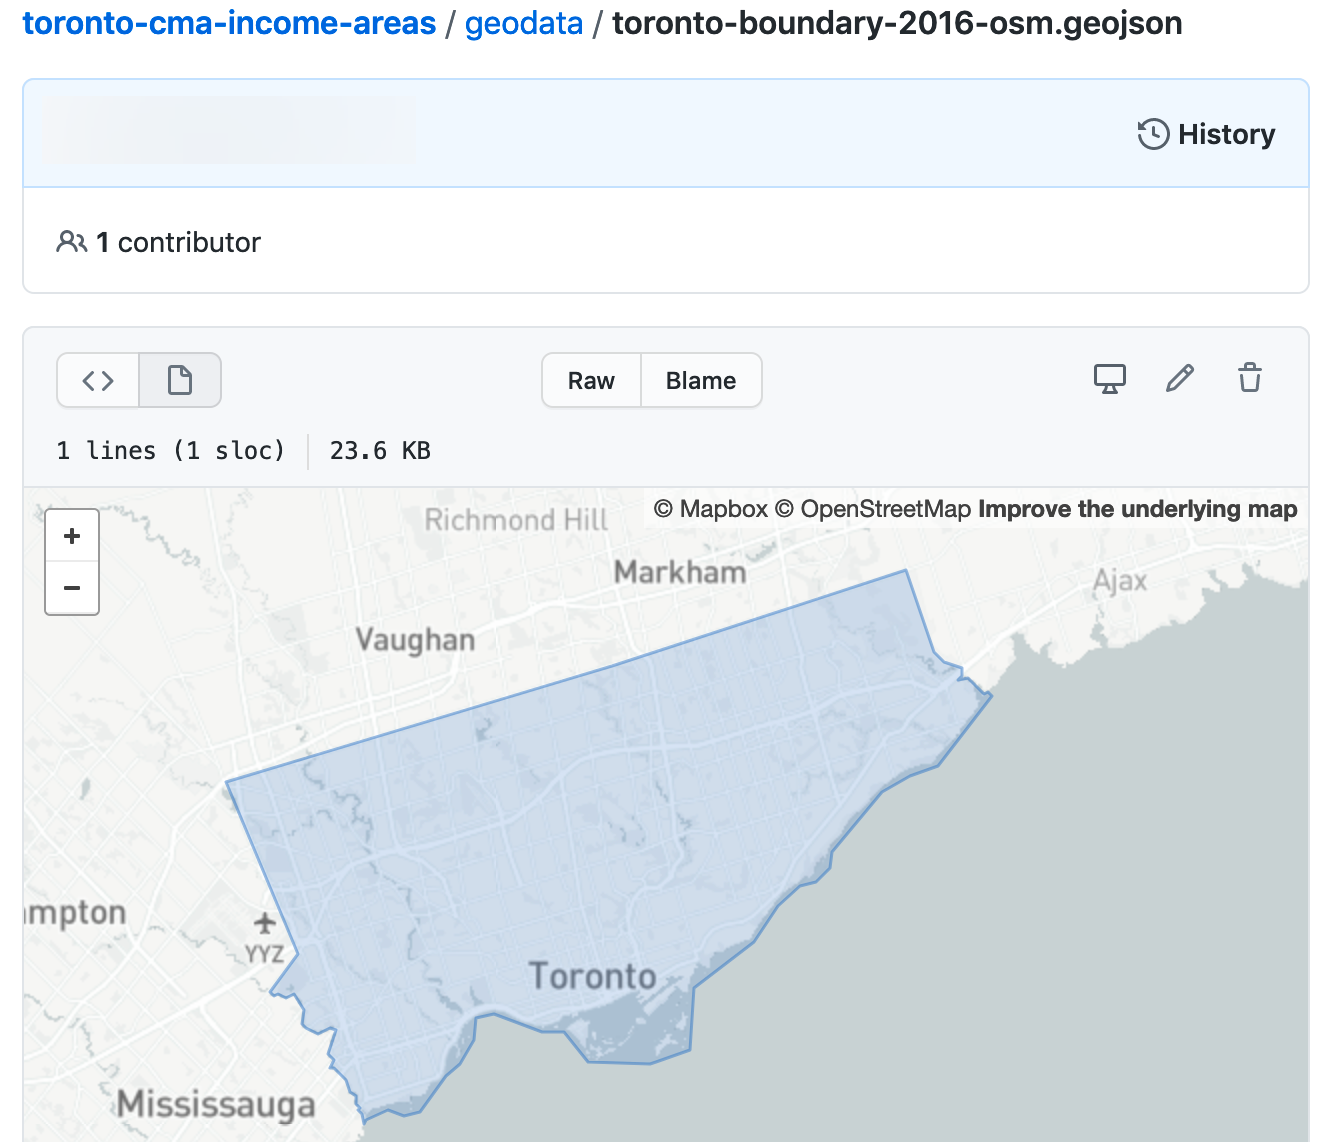
Figure 13.2: GitHub repositories automatically show a map preview for GeoJSON files.
Warning: In GeoJSON format, coordinates are ordered in longitude-latitude format, the same as X-Y coordinates in mathematics. But this is the opposite of Google Maps and some other web map tools, which place coordinate values in latitude-longitude format. For example, Hartford, Connecticut is located at (-72.67, 41.76) according to GeoJSON, but at (41.76, -72.67) in Google Maps. Neither notation is right or wrong. Just make sure you know which one you are dealing with. Tom MacWright created a great summary table showing lat/lon order of different geospatial formats and technologies.
Now that you’ve been introduced to the GeoJSON geospatial file format, let’s compare it with some other formats.
Shapefiles
The shapefile format was created in the 1990s by Esri, the company that develops
ArcGIS software. Shapefiles typically appear in a folder of files with extensions
such as .shp, .shx, and .dbf, and the folder may be compressed into a .zip file.
Government agencies commonly distribute map data in shapefile format. But the standard tools for editing shapefiles—ArcGIS and its free and open-source cousin, QGIS—are not as easy to learn as other tools in this book. For this reason, we recommend converting shapefiles into GeoJSON files if possible, and you can do this with the Mapshaper tool, discussed a bit later in the chapter.
GPS Exchange Format (GPX)
If you ever recorded your run or bike ride with a GPS device, chances are you ended up with a .gpx file.
GPX is an open standard and is based on XML markup language.
Like GeoJSON, you can inspect the contents of a GPX file in any simple text editor. Most likely, you will see a collection timestamps and latitude/longitude coordinates that the GPS device recorded at that particular time. You can convert GPX to GeoJSON format with the GeoJson.io tool, discussed later in this chapter.
Keyhole Markup Language (or KML)
The KML format rose in popularity during the late 2000s, when it was developed for Google Earth, a free and user-friendly tool to view and edit two- and three-dimensional geographic data. KML files were also used with maps powered by Google Fusion Tables, but that tool was dropped by Google in late 2019. You can convert your KML file into GeoJSON format with the GeoJson.io tool described later in this chapter.
Tip: Sometimes .kml files are distributed in a compressed .kmz format. To learn how to transform them, see the Converting from KMZ to KML format section of this chapter.
MapInfo TAB
The proprietary TAB format is created and supported by MapInfo, Esri’s competitor, and is designed to work well with MapInfo Pro
GIS software. Similar to Esri’s shapefiles, MapInfo TAB files usually appear in a folder with extensions that end with .tab, .dat, .ind, and some other files. Unfortunately, you will most likely need MapInfo Pro, QGIS, or ArcGIS to convert these to Shapefile or GeoJSON format.
We’ve mentioned only a handful of the most common geospatial file formats, and there is a myriad of lesser-known formats. Remember that GeoJSON is one of the best, most universal formats for your vector data, and we strongly recommend that you store and share your point, polyline, and polygon data in this format. In the next section, we will describe how to find GeoJSON boundary files for many locations around the globe.