#StandWithUkraine - Stop the Russian invasion
Join us and donate. Since 2022 we have contributed over $5,000 in book royalties to Save Life in Ukraine & Ukraine Humanitarian Appeal & The HALO Trust, and we will continue to give!
Choropleth Map with Tableau Public
We first introduced you to the free Tableau Public desktop application (for Mac or Windows) when building scatter charts and filtered line charts in Chapter 6. Now let’s use the same tool to create an interactive choropleth map, and compare the process with the Datawrapper tool we learned in the prior section. We’re showing you how to create the same type of map with both tools, in order to show you the difference. On one hand, Datawrapper gives you more control over interpolating data and shaping the appearance of color intervals in your choropleth map. On the other hand, some people prefer Tableau Public because they’re already familiar with its interface.
Tableau Public can create many different types of map for geographical place names or ISO codes it already recognizes, such as nations, states, counties, and airports. But Tableau Public cannot geocode street addresses by itself, so you’ll need to obtain their latitude and longitude with another tool, such as those described in the geocode section of Chapter 2. Furthermore, if you want to upload customized map boundaries, learn how to Create Tableau Maps from Spatial Files on the support page.
In this section, we will create a choropleth map of healthcare spending per country as a percentage of their gross domestic product (GDP), as shown in Figure 7.58. Remember that choropleth maps work best when we normalize the data to show relative, rather than absolute, numbers. Creating a map of total health spending per country would not be very meaningful, as larger nations tend to have larger economies, so we’ll base our map on the percentage of their economy that is spent on healthcare.
Figure 7.58: Choropleth map of healthcare spending with Tableau Public. Explore the interactive version. Data from the World Bank.
Let’s look at the steps involved to create a choropleth from Figure 7.58 in detail.
- Open the Healthcare Spending by Nation as Percent of GDP data in Google Sheets, which we downloaded from the World Bank. Examine the data and the notes.
Good maps often require cleaning up messy data as described in Chapter 4. In our spreadsheet we removed rows for nations that did not report any data. Tableau Public recognizes many different types of geographic names (such as cities and nations), so we will rely on the tool to deal with any spelling issues and properly place all of them on the map.
In the Google Sheet, go to File > Download and select Comma-Separated Values (CSV) format to save the data to your local computer.
If you have not already done so, create a free Tableau Public profile page, or click the Sign In button to access your existing profile, then click the Create a Viz button in your browser, as shown in Figure 7.59.

Figure 7.59: Click the Create a Viz button when logged into your Tableau Public profile page.
Tip: In 2021, Tableau Public launched its beta version to create data visualizations directly in your browser when logged into your Tableau Public profile page. Previously, you needed to install the free Tableau Public desktop application for Mac or Windows, which is still available for those who prefer it.
- When the Connect to Data window appears, as shown in Figure 7.60, upload the healthcare spending CSV data file you downloaded in the prior step.
Tip: Tableau Public also lets you access data directly from external servers using its Connectors menu. So instead of downloading a CSV file in step 2, you could have linked directly to a Google Sheet in your Google Drive, but doing this requires a few extra steps to grant permission.
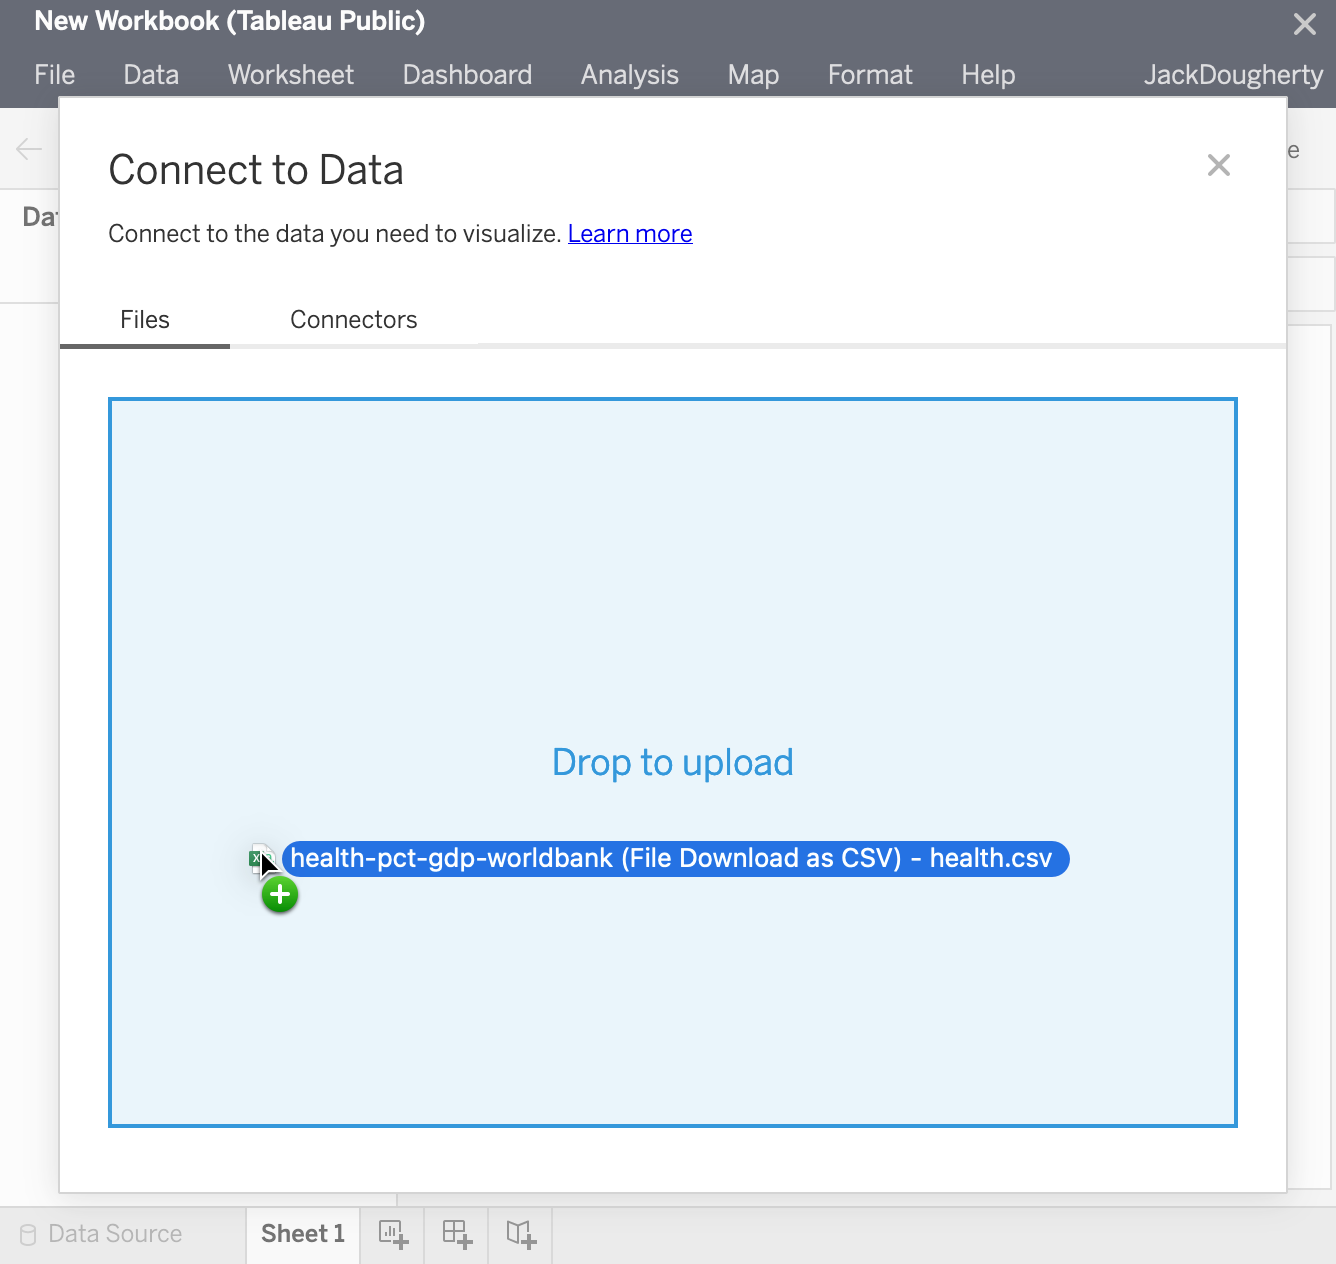
Figure 7.60: In the Connect to Data window, upload your CSV file.
- After you import data, Tableau Public automatically advances to display Sheet 1 of your New Workbook in your browser, with individual tables listed in the left menu, as shown in Figure 7.61.
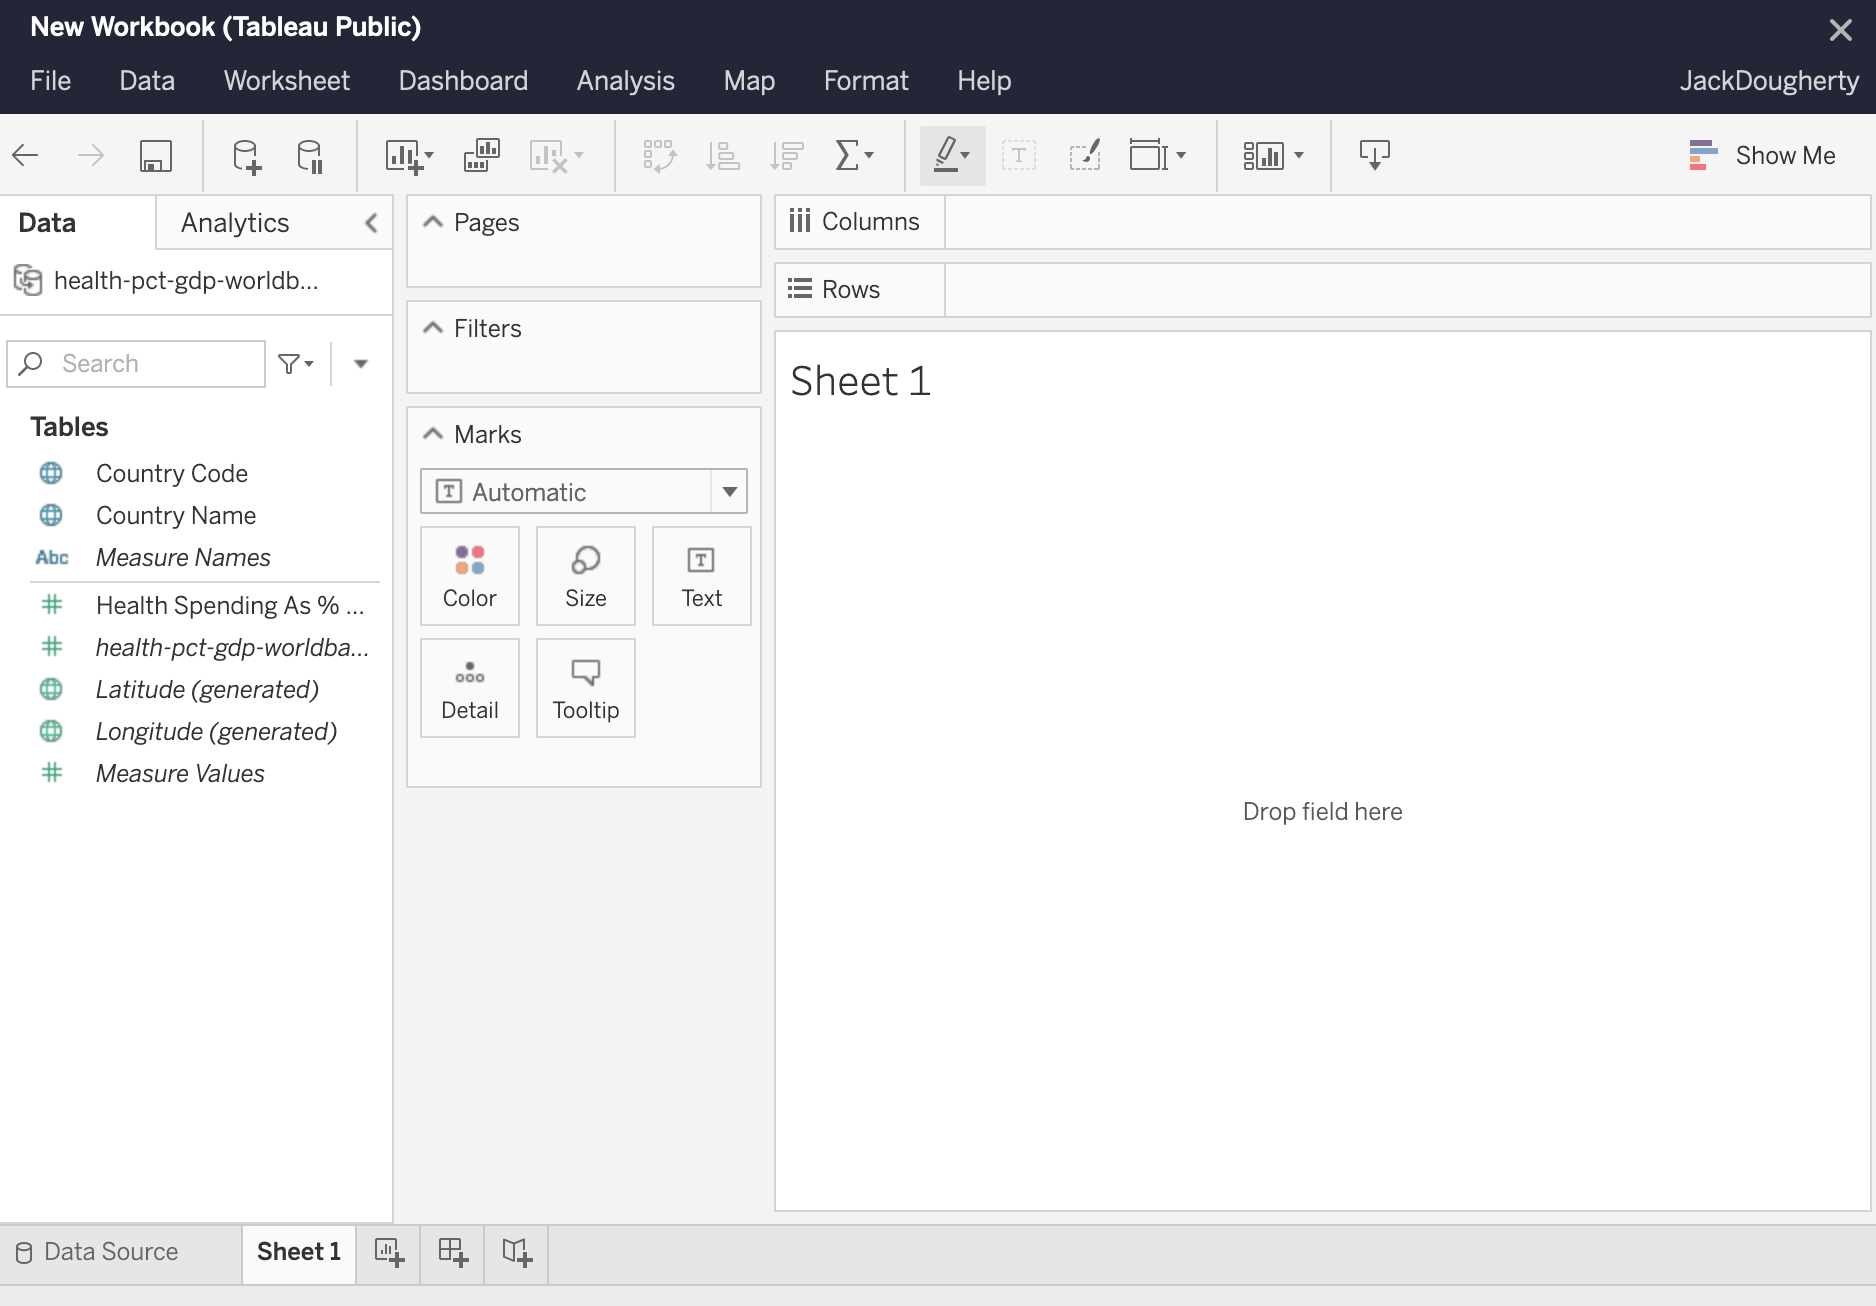
Figure 7.61: Tableau Public has uploaded your data into the left menu Tables menu in Sheet 1.
Tip: Notice that a small globe icon appears next to Country Name and Country Code, which shows that Tableau Public successfully recognized these as geographic data, rather than string or text data. If Tableau does not automatically recognize your geographic data, you will need to manually change the data type. To do so, click the data type icon (e.g. globe or a green # for numeric values), and then choose Geographic Role > Country/Region as shown in Figure 7.62. Also, you can inspect your data upload in the Data Source tab.
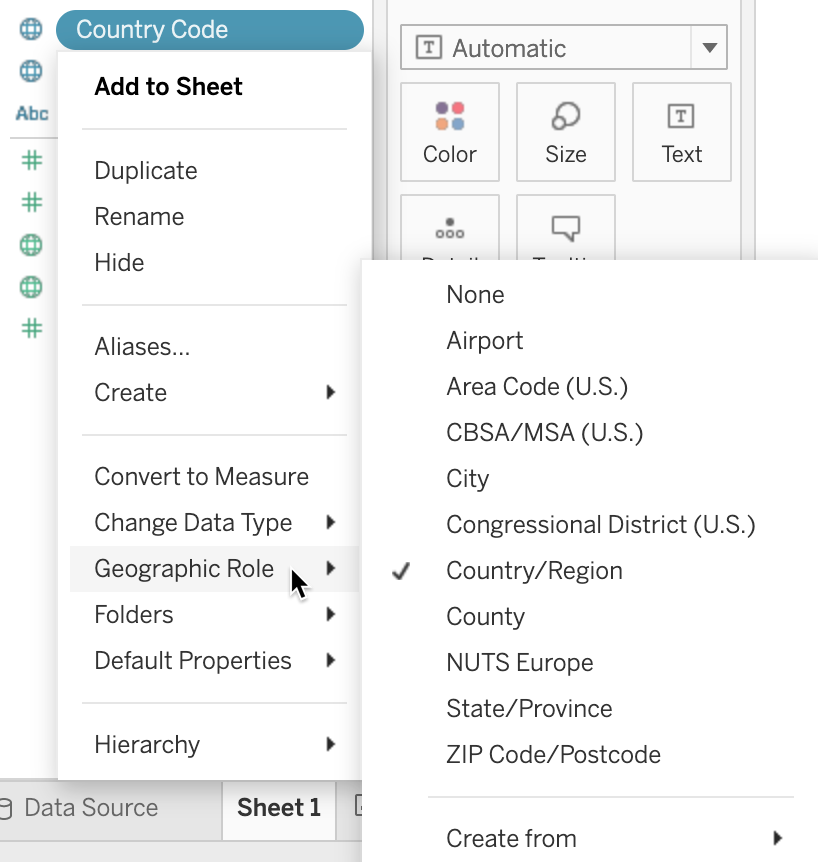
Figure 7.62: Make sure Tableau Public knows that the Country Name column contains geographic data.
- In Sheet 1, create your choropleth map using a two-step process, as shown in Figure 7.63. First, drag-and-drop the Country Name field into the middle of the worksheet (alternatively to the Detail box of the Marks card) to create the map. The default view is the symbol map, which we need to replace with a polygon map. To add colored polygons, drag-and-drop the Health Spending As % of GDP field into the Color box of the Marks card to transform it into a choropleth map.
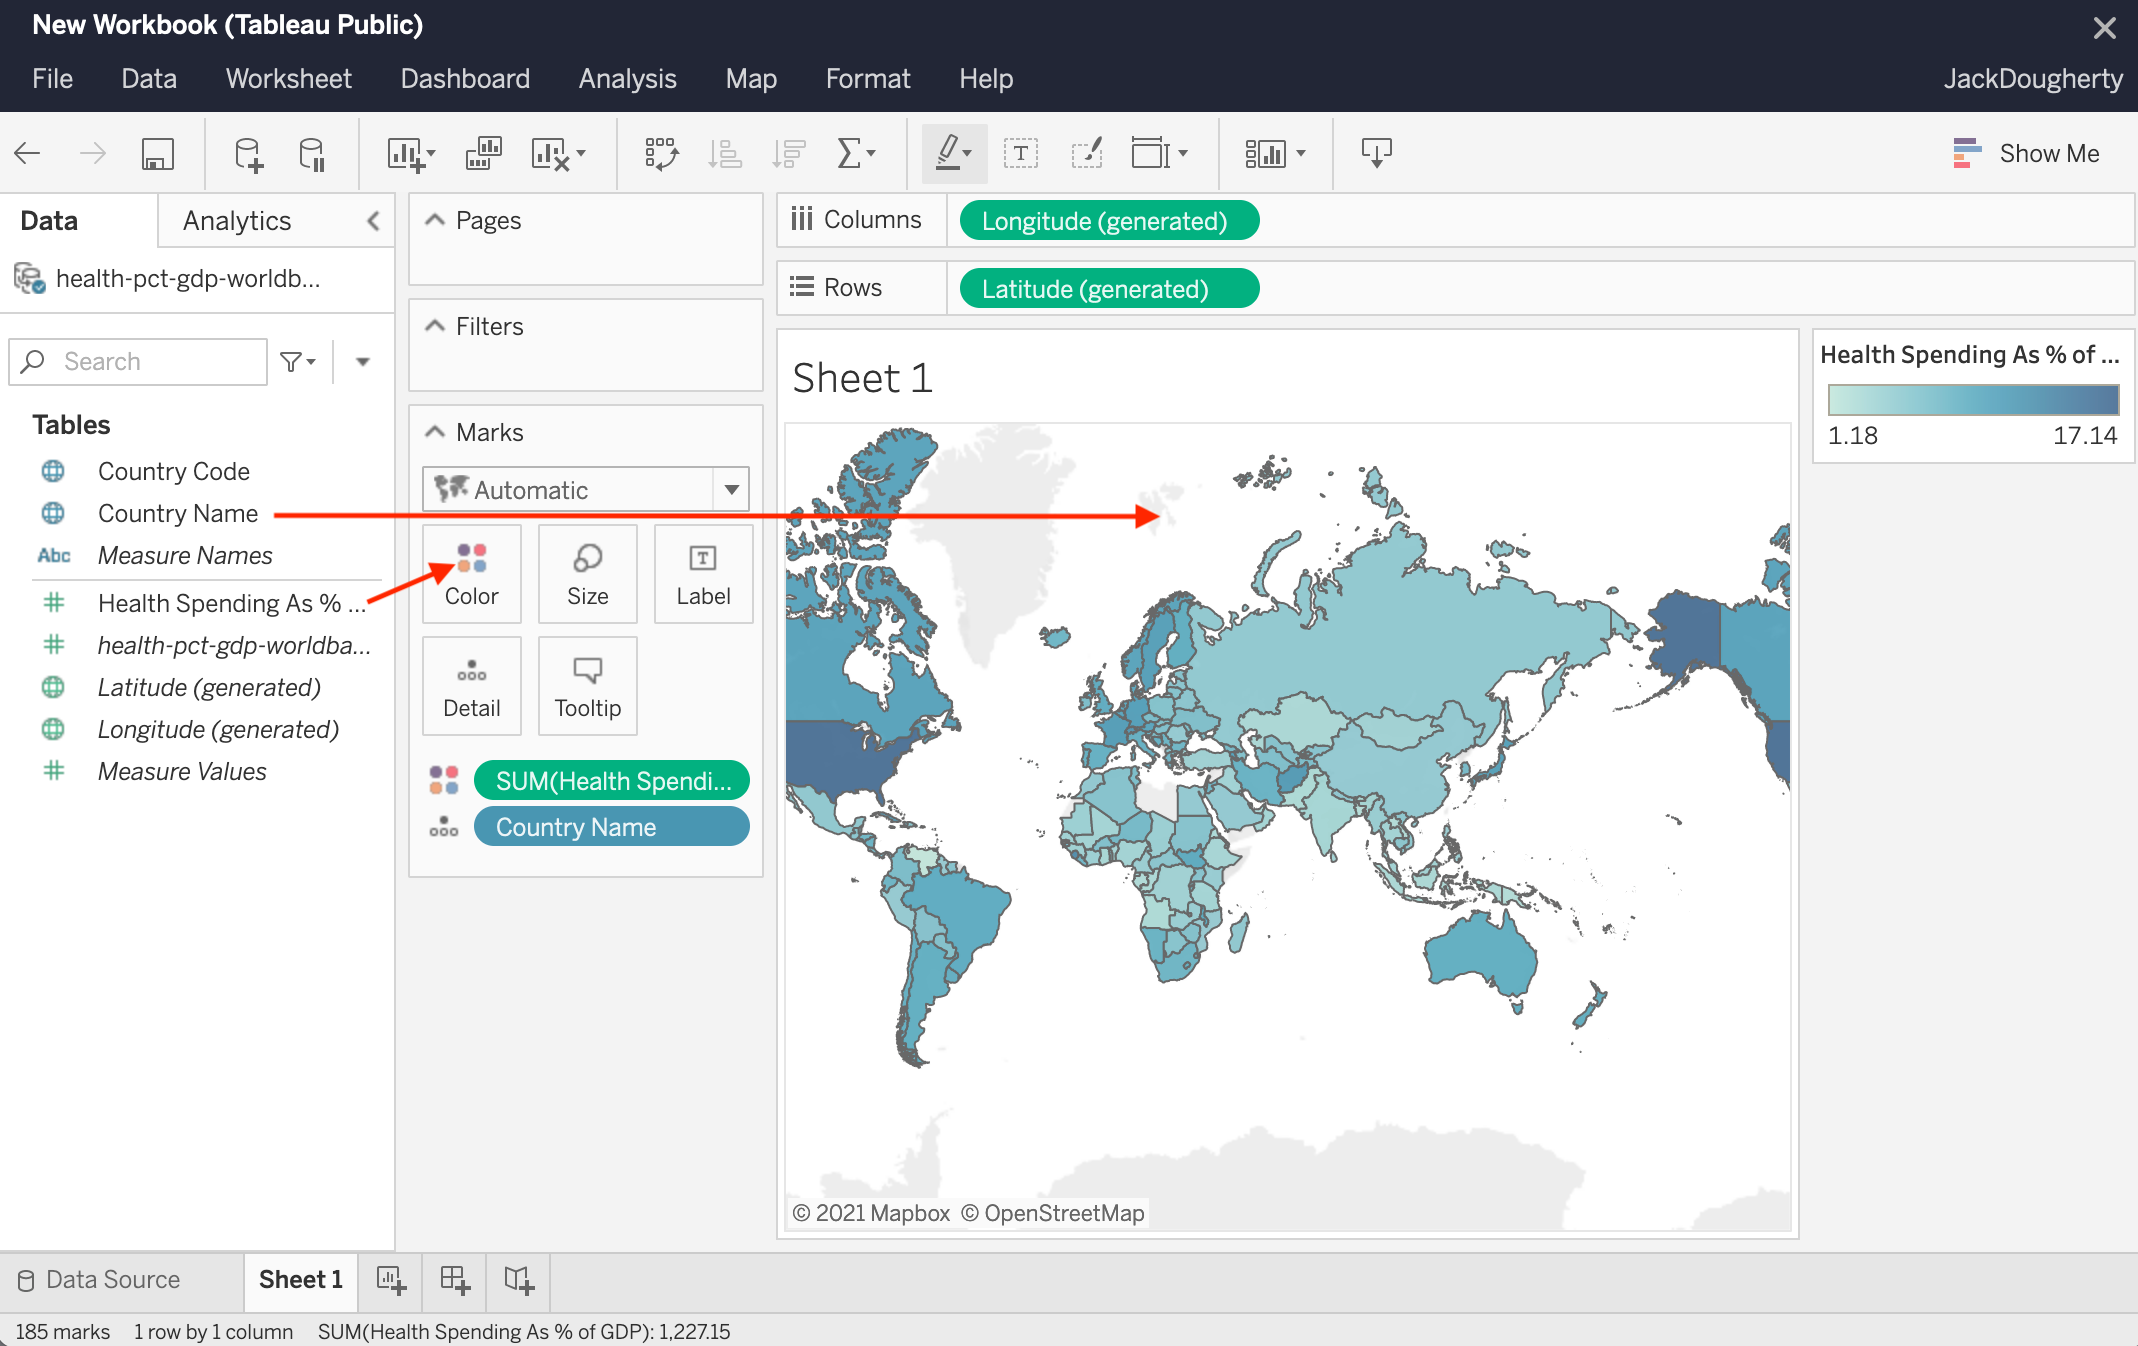
Figure 7.63: Drag and drop Country Name to the center of the sheet, then Health Spending As % of GDP to the Color box in the Marks card.
Tip: If you cannot see the map legend, sometimes Tableau Public hides it behind the Show Me menu in the upper-right corner, so click the menu to shrink it if necessary.
- You can change the color palette by clicking the Color box of the Marks card, and then Edit colors. Change the palette to Green, and change it from continuous to steps, as shown in Figure 7.64.
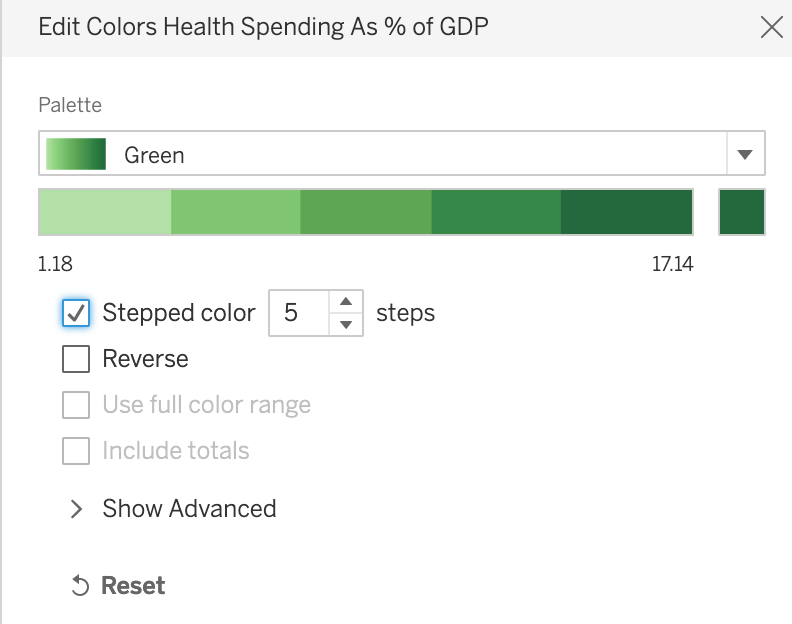
Figure 7.64: Change the color scheme to Green with 5 steps.
- When you hover over countries, you will notice a tooltip that tells you the name of the country and gives you the percent value. It is generally well-formatted as our initial data table had proper column headers. But we can make the tooltip even better. Click the Tooltip box of the Marks card, change the first instance of
Country Nameto justCountry(do not change the text inside<and>as these are variable names), and add a%sign at the end of the second line, as shown in Figure 7.65.
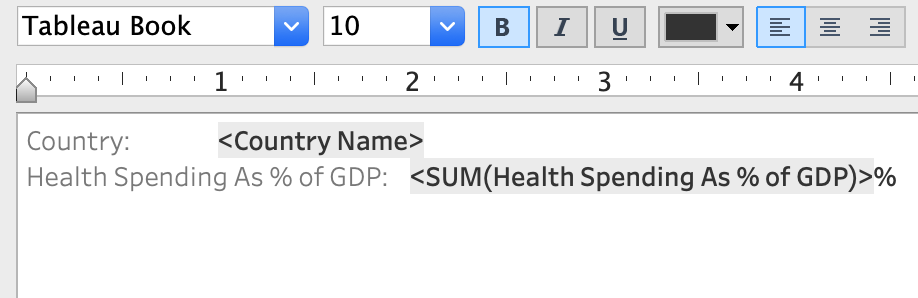
Figure 7.65: Change tooltip text to make it more user-friendly.
Let’s make our map title more meaningful. Double-click the default Sheet 1 name just above the map to bring up the Edit Title window, and change the name of your chart to 2017 Healthcare Spending by Country as % of GDP.
At this point the data is loaded and should be displayed correctly, so we are going to create the final layout that includes map’s title and credits, the legend, and is appropriate for sharing. At the bottom-left of the program, create a New Dashboard, as shown in Figure 7.66. Dashboards in Tableau are layouts that can contain visualizations from multiple sheets, as well as text boxes, images, and other elements, creating rich exploratory interfaces. In this tutorial, we will stick to just a single sheet that contains our choropleth map.
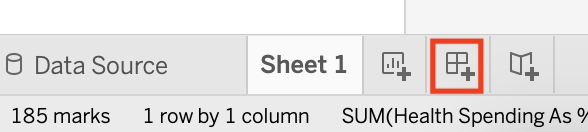
Figure 7.66: Before you publish the map, create a new dashboard to finalize your layout.
- In your Dashboard 1 tab, change the size of the dashboard to Automatic so that the map is responsive and occupies 100% of the width on all devices. Drag and drop Sheet 1 to the Add sheets here area, as shown in Figure 7.67. This will copy the map, the title, and the legend from Sheet 1.
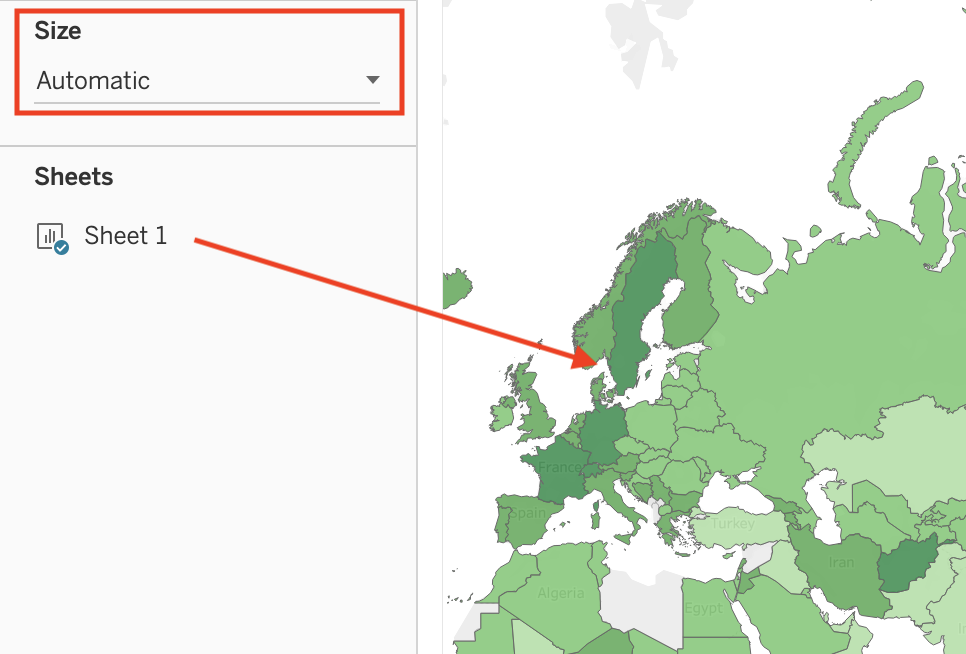
Figure 7.67: To create a responsive dashboard, change the Size to Automatic.
- Right-click the upper part of the map legend, and select Floating, as shown in Figure 7.68. Now you are able to place your legend directly on top of the map to save space. Drag and drop it to one of the map’s corners.
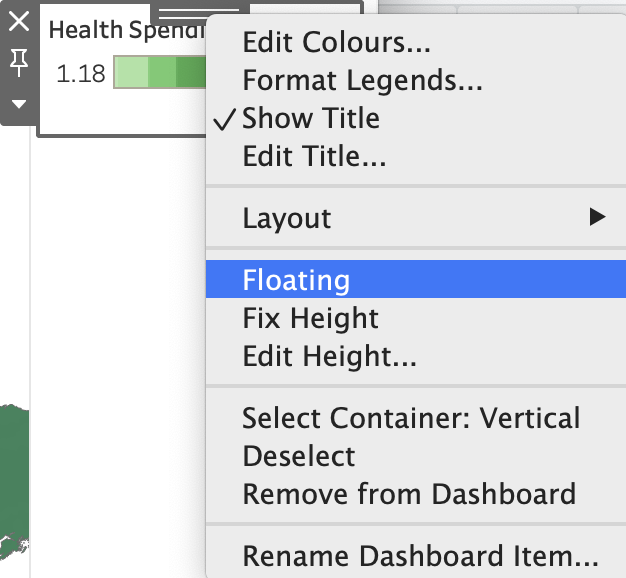
Figure 7.68: To place the legend on top of the map, make sure it is floating.
Finally, let’s add a text block with data source underneath the map. From the Objects menu in the left-hand side, drag and drop Text to the lower half of the map. In the Edit Text window that appears, type Data by the World Bank, 2017, and click OK. Initially the text area will occupy half the height of the screen, so resize it like you would resize any window on your computer. Also, position your map’s center and zoom level as you want it to be visible by others. In this case, the best would be to have a world view as we are showing data for most countries, although you may want to zoom in to a specific continent.
When you are ready to publish your map online, go to File > Save As to your Tableau Public profile. Give it a title, such as Healthcare Spending, and click Save. See how to embed the map as an iframe in Chapter 9.
Warning: When you first try to save the map to your Tableau Public account, you will get an error saying that “the data source needs to be an extract” and you can read more about data extracts in Tableau Help. Go back to the Data Source tab, and click the Create Extract button in the upper-right corner. Tableau will take a few moments to manipulate the original CSV data, after which you can successfully save the map to your profile with File > Save As.
Tip: Tableau may not be the best tool to create choropleth maps where you want to have full control of color breaks. By default, Tableau uses a linear color scheme that, as we’ve learned earlier in the chapter, is prone to highlighting outliers, and there is no straightforward way to change the intervals to non-linear methods such as quantiles. If you are not happy with the way the linear scale represents your data, you can filter your data to remove outliers from the map, or see Andy Kriebel’s VizWiz tutorial to use table calculations to group items into quantiles, or create your choropleth map in Datawrapper, which gives you more control over color intervals and interpolation.
In all of the prior tutorials, you created interactive maps using static data, meaning it came from a spreadsheet. In the next tutorial, you’ll learn how to build a map using continuously-updated data from a Socrata open data repository, which will always display the most current information.