#StandWithUkraine - Stop the Russian invasion
Join us and donate. Since 2022 we have contributed over $5,000 in book royalties to Save Life in Ukraine & Ukraine Humanitarian Appeal & The HALO Trust, and we will continue to give!
Point Map with Google My Maps
Most people are already familiar with Google Maps, the web mapping service that allows users to look up locations and directions around the world. In this section you’ll learn about Google My Maps, a related tool that allows you to display groups of points on top of the Google Maps platform, which users can click on to reveal more data, including photos, websites, or directions. You can customize the colors and icons for your point markers, and all of the map layer content you create will reside in your Google Drive, where you can edit and collaborate with others. Although Google My Maps has limited features, it’s an easy-to-learn tool to build a basic interactive point map, along with simple polylines and polygons if desired. Finally, you can share a public link to your map or embed it on your website, a step that you’ll learn more about in Chapter 9: Embed on the Web.
In this section, we will construct a point map of museums and parks in North America, with two different groups of styled markers and a custom photo icon. When users click on a marker, additional text, links, and images appear in the pop-up window, as shown in Figure 7.22.
Figure 7.22: Point map of parks and museums created with Google My Maps. Explore the interactive version.
To create your own interactive point map with custom icons, follow this tutorial:
Open the Parks and Museums data in Google Sheets, which contains six popular locations in North America. Each row includes a Group, Name, Address, and URL. Log into your Google account and go to File > Make a Copy to create a version you can edit in your Google Drive.
Navigate to Google My Maps. In the upper-left corner, click the + Create a New Map button, as shown in Figure 7.23. This will create an empty map with familiar Google Maps style.
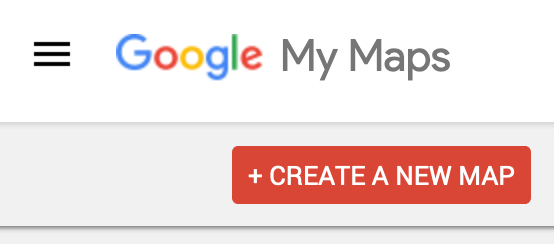
Figure 7.23: Navigate to https://www.google.com/mymaps/ and create a new map.
- Add a relevant title and description by clicking its current title, Untitled map, and typing in the new information, as shown in Figure 7.24.
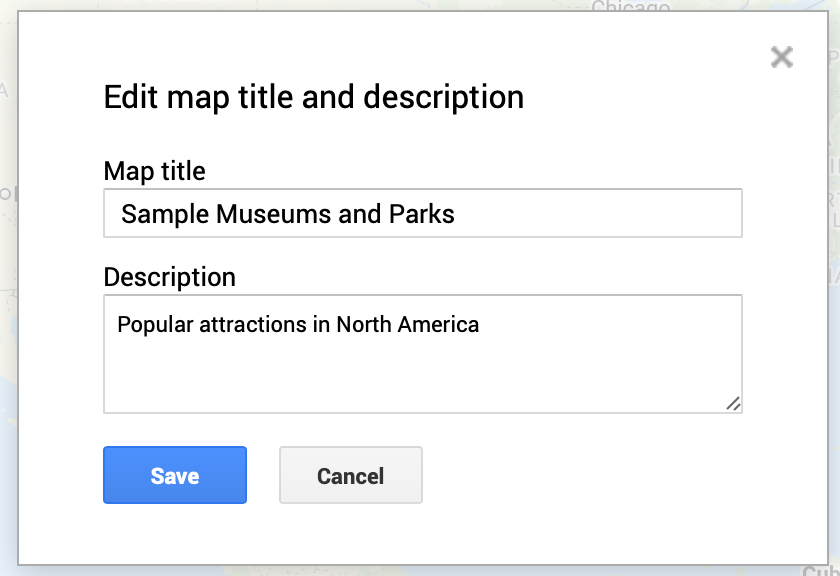
Figure 7.24: Add title and description to your map.
- To add data to your map, click the Import button under the Untitled layer item, as shown in Figure 7.25.
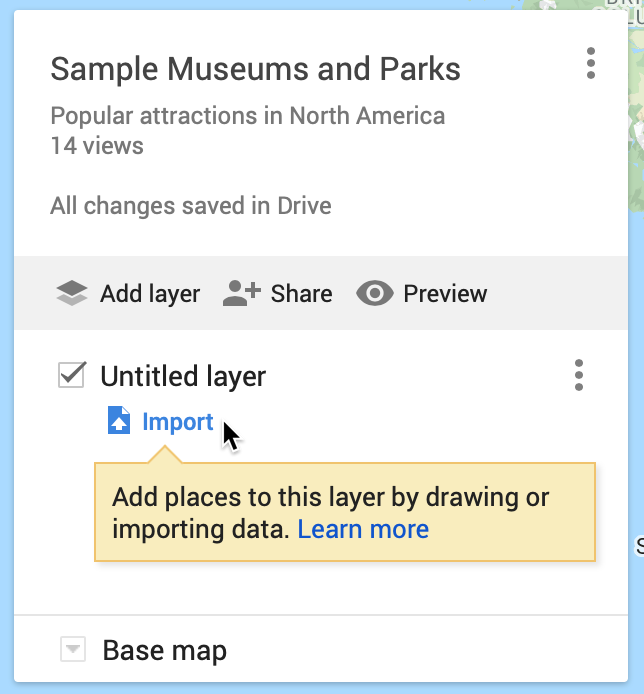
Figure 7.25: Click the Import button to add a data layer to your map.
- In the Choose a file to import screen, there are several ways to upload data. Choose Google Drive, since our sample data is already in that format, and select the Recent button to locate the Museums and Parks file you saved to your Google Drive, as shown in Figure 7.26. Press Select.
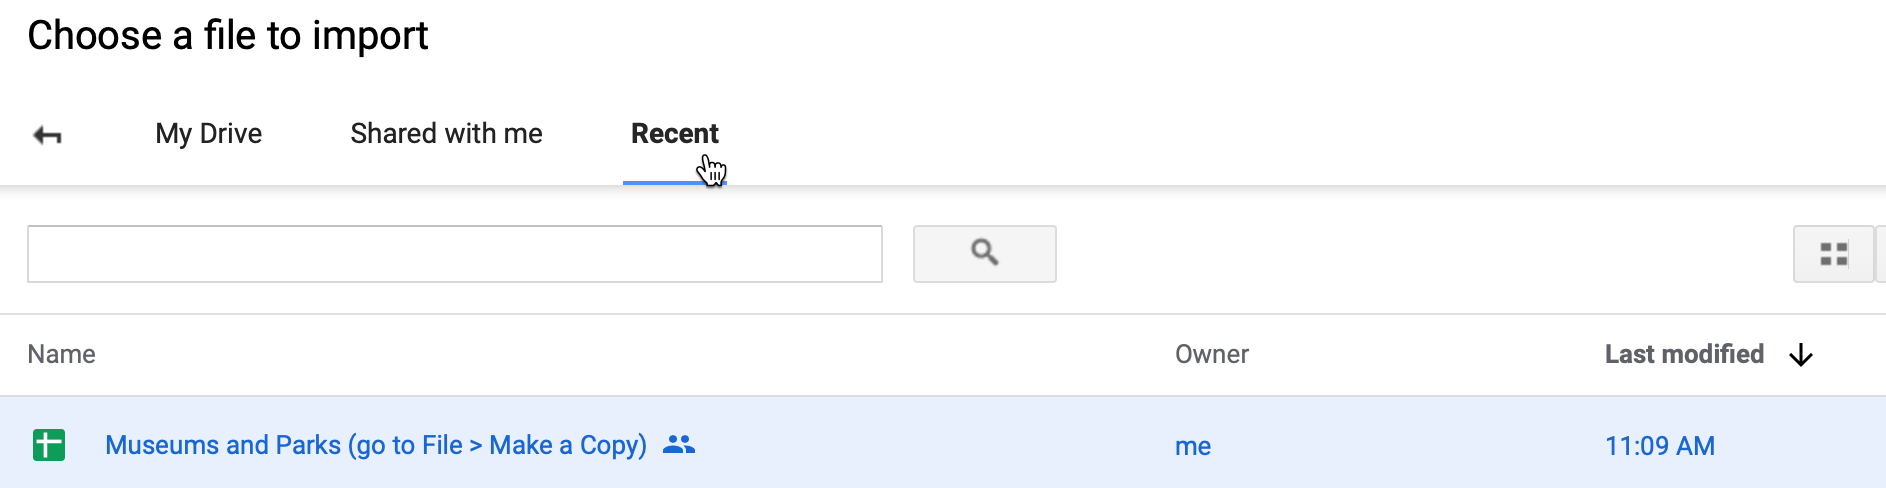
Figure 7.26: After you choose to import your data through Google Drive, select the Recent button to find the file.
- In the Choose columns to position your placemarks screen, select the Address column to place your point data on the map, as shown in Figure 7.27. Press Continue.
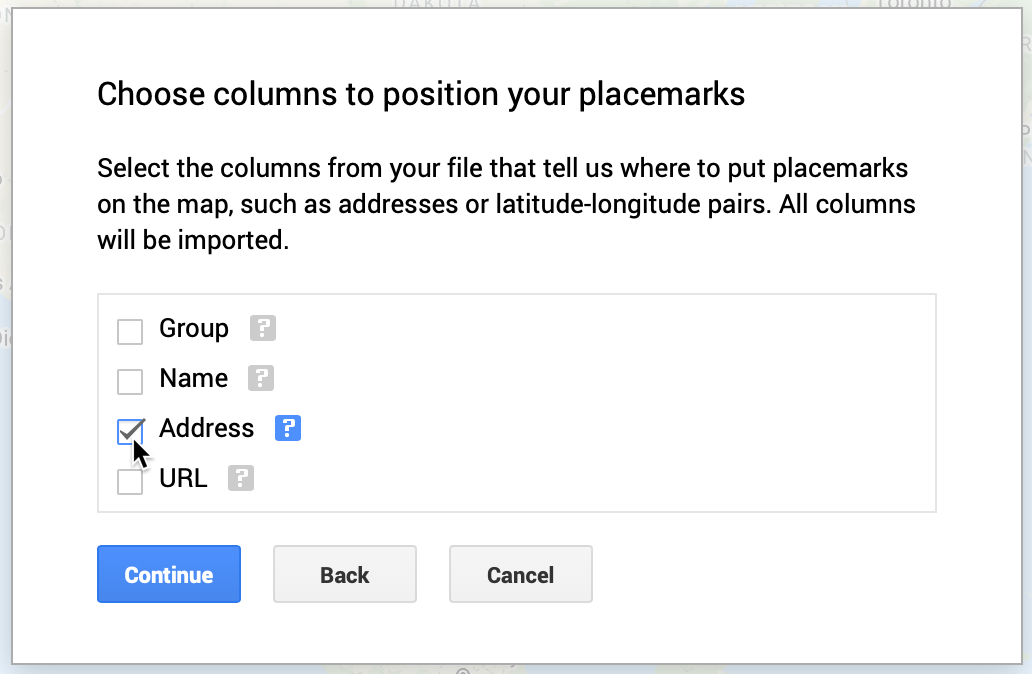
Figure 7.27: Select Address to place your data on the map.
Tip: You can select multiple boxes if your address is split across several columns, such as Address, City, State, Zipcode. Also, if your point data is already geocoded, you can upload latitude and longitude pairs, such as 41.76, -72.69.
- In the Choose a column to title your markers window, select the Name column to title your point markers, as shown in Figure 7.28. Then click Finish.
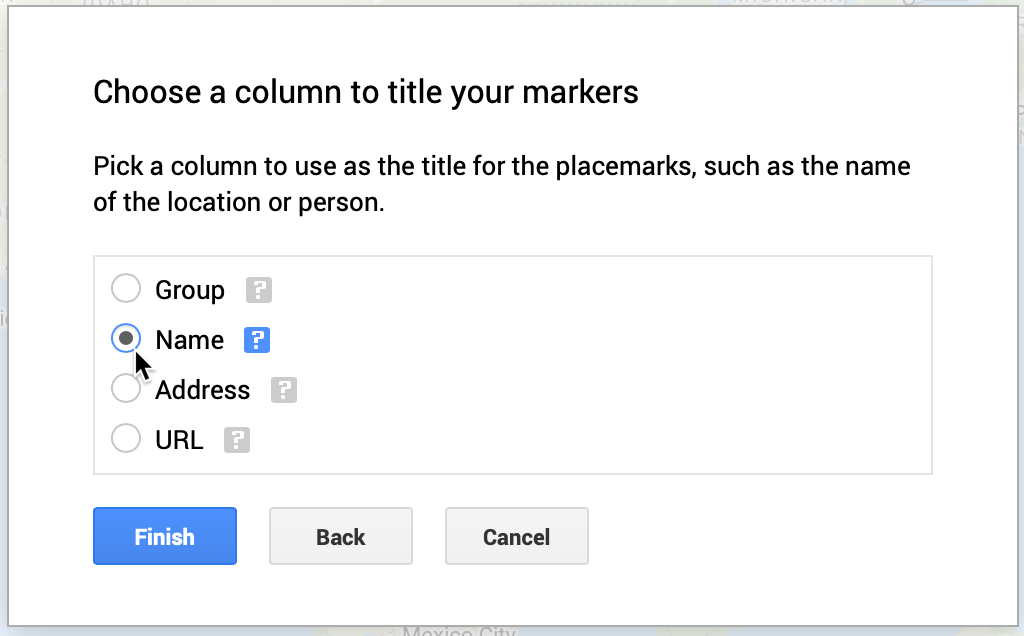
Figure 7.28: Select the Name column to title your point markers.
Google My Maps will automatically geocode your address data as we discussed in chapter 3, display them using its default blue markers, and center the map to fit all of the points.
- Click the three-dot kebab menu next to the Museums and Parks… layer to Rename and shorten its name, since the full name of the file is imported by default, as shown in Figure 7.29.
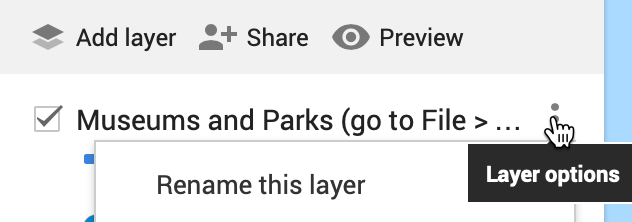
Figure 7.29: Click the three-dot kebab menu next to the layer to shorten its name.
- Since our map contains two groups—museums and parks—let’s create a custom color marker for each group to replace the default blue markers. Click on Individual styles, and in the Group places by dropdown, change the value to Style data by column: Group, as show in Figure 7.30. This option is available because we intentionally created the Group column for museums and parks when setting up the sample data. Close this window by clicking the upper-right X symbol.
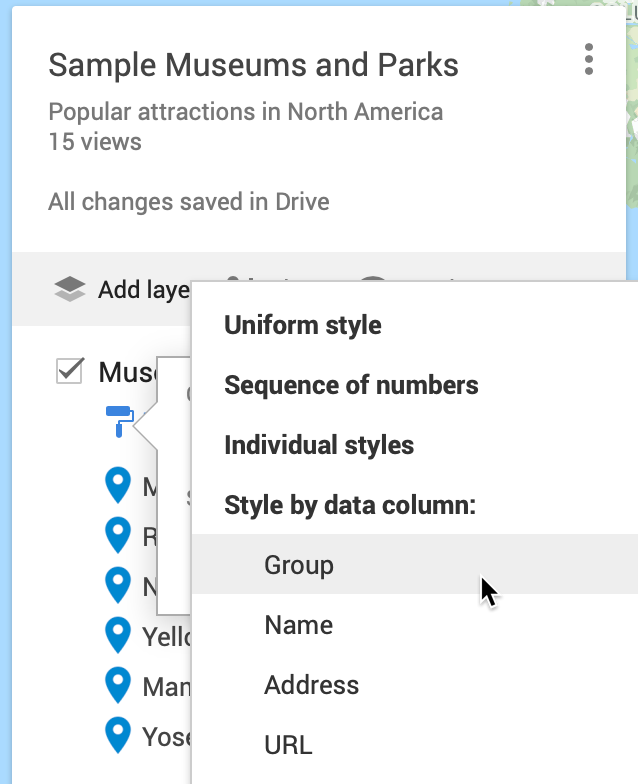
Figure 7.30: Change Individual styles to Group places by: Group.
- Under Styled by group, float your cursor over the Museum label to reveal the bucket styling symbol, and click it, as shown in Figure 7.31.
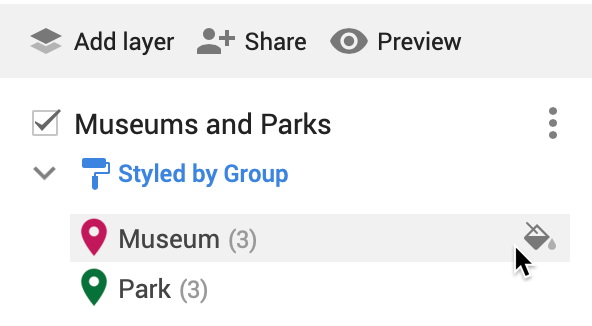
Figure 7.31: Float your cursor over a label to reveal the bucket styling symbol.
- Assign a new color for Museums, and click More icons to find a more appropriate point marker symbol, as shown in Figure 7.32.
Figure 7.32: Select point marker colors and icons.
- In the Choose an icon screen, use the upper-right Filter to search for icon types by name, such as “Museum” as shown in Figure 7.33. Repeat this process for Parks.
Figure 7.33: Search by filter in the Choose an icon screen.
- In the Choose an icon screen, you can click the lower-left Custom icon button to upload an image, which will be transformed into a thumbnail image icon, as shown in Figure 7.34. This custom icon was created from a Wikimedia image of the Washington Monument.
Figure 7.34: Upload a photo to create a custom thumbnail icon image.
- Click on any map marker to edit its data, insert a photo to appear in its pop-up window, or add Google Map directions, as shown in Figure 7.35. This photo came from a Wikimedia image of the Metropolitan Museum of Art. However, you must add photos or directions manually, since these links cannot be pre-loaded into the data spreadsheet.
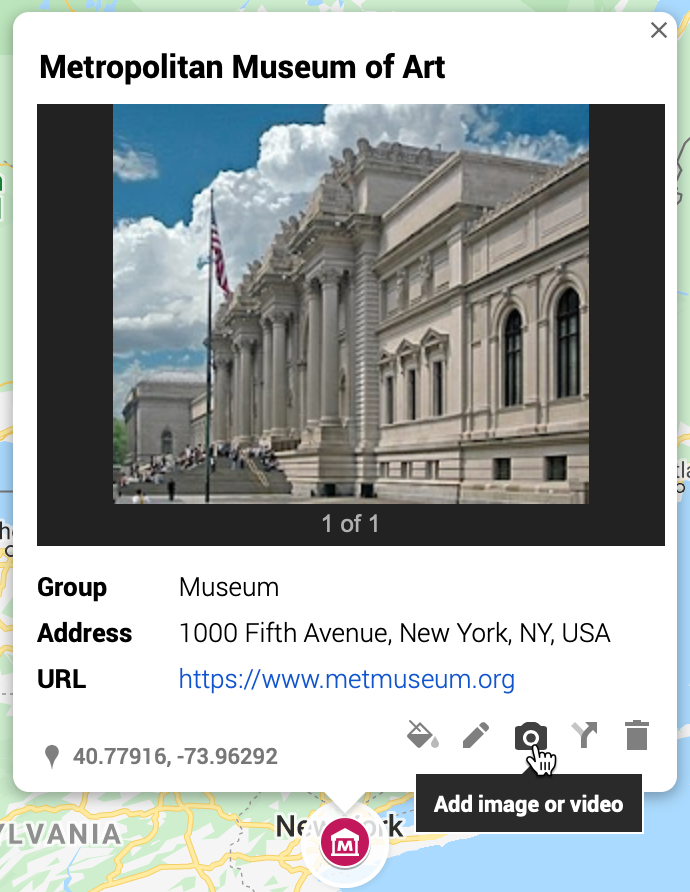
Figure 7.35: Click any map marker to edit its data, add a photo, or directions.
- You can change the style of the basemap to one of nine different versions offered by Google, as shown in the drop-down menu in Figure 7.36. Choose high-contrast colors for marker icons and basemap backgrounds.
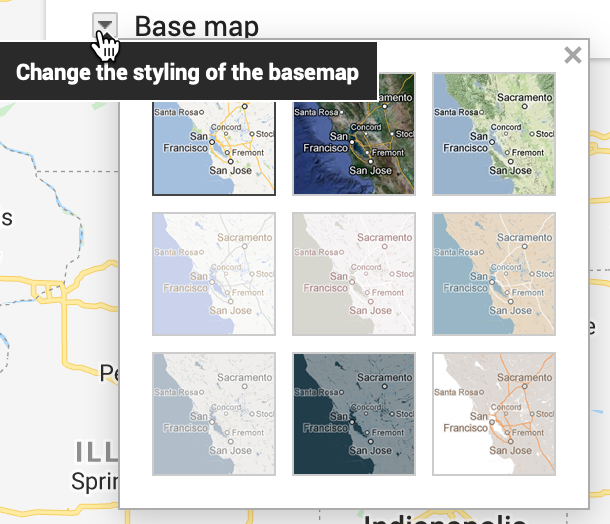
Figure 7.36: Change the style of the Google basemap.
- At the top of the map, see buttons to manually add more point markers, draw a line, add directions, or measure distance, as shown in Figure 7.37. However, Google My Maps has limited support for polylines and polygons, and you cannot easily create a choropleth map with colored boundaries that represent data values.
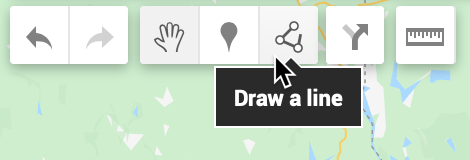
Figure 7.37: Manually add more point markers, lines, and directions, or measure distance.
- Click Preview to see how you map will appear to other people. When you finish editing your map, click the Share button underneath the map’s title and description, and in the next screen, make sure Enable link sharing is activated, as shown in Figure 7.38, and copy the generated link. You can share with link with anyone, with or without a Google account. You also have the option to make your map publicly appear in web search results, if desired.
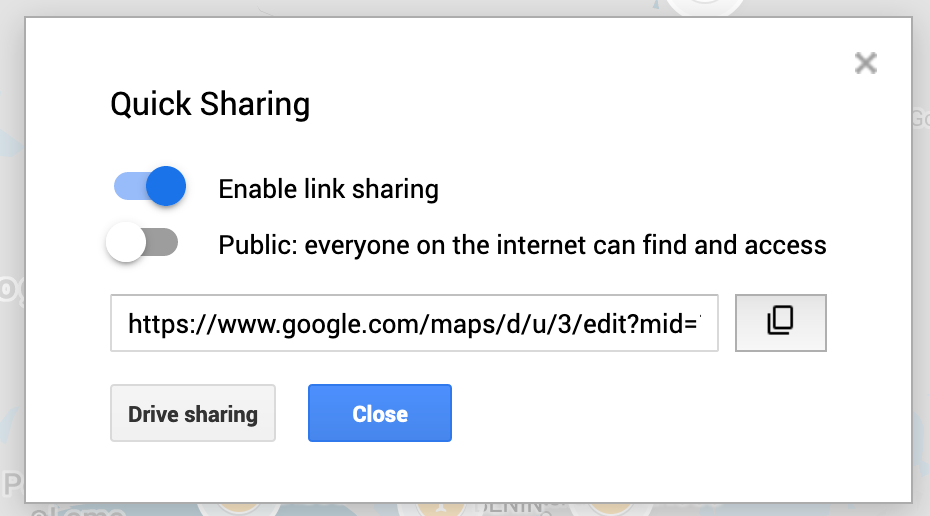
Figure 7.38: Before sharing your map, make sure anyone with the link can view it.
- If you wish to embed your map as an iframe on a web page, click the 3-button kebab menu to the right of the map title and select Embed on my site, as shown in Figure 7.39. This will generate an HTML embed code, which we will explain in Chapter 9: Embed on the Web.
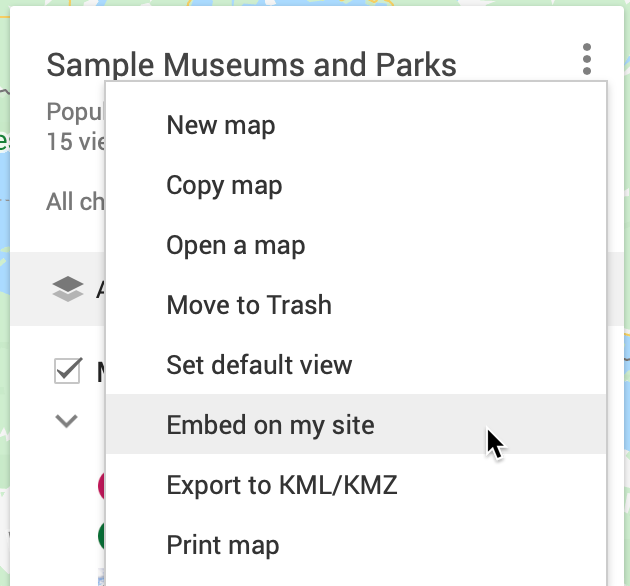
Figure 7.39: Select Embed on my site to copy the HTML iframe code.
- If you wish to edit your map in the future, here are two ways to access it when logged into your Google account. One way is to open the Google My Maps platform to view all of your maps. A second way is to go to your Google Drive and search for your Google My Maps by keyword. When you create a Google My Map from data in a Google Sheet, we recommend that you keep the My Map and Sheet files together in the same folder in your Google Drive, as shown in Figure 7.40, to help you make edits more easily in the future.
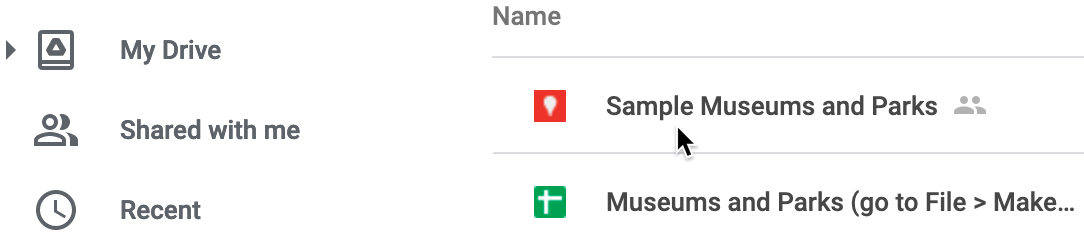
Figure 7.40: Keep your Google My Maps and Sheets files together in a Google Drive folder.
Google My Maps is basic tool for making point maps with custom icons and grouped categories. You can design maps with multiple layers of points, polylines, and basic polygons, if desired. But the overall map design and features are limited to what the Google My Maps platform offers. Learn more at the Google My Maps support page.
In the next section, we’ll explore how to use Datawrapper to create symbol point maps, where the size and color of each circle (or other shapes) represents data values for that specific point.