#StandWithUkraine - Stop the Russian invasion
Join us and donate. Since 2022 we have contributed over $5,000 in book royalties to Save Life in Ukraine & Ukraine Humanitarian Appeal & The HALO Trust, and we will continue to give!
A.3 Diagnose with developer tools
We recommend learning how to use your browser to diagnose other types of issues discussed later in this appendix, such as common iframe errors or code template issues. Most browsers contain developer tools that allow you to view the source code of a web page and spot any errors that it flags. Even if you’re not a software developer, learning how to open your browser’s developer tools allows you to peek under the hood and make a more informed guess about what’s not working. To open developer tools in various browsers:
- In Chrome, go to View > Developer > Developer Tools.
- In Firefox, go to Tools > Web Developer > Toggle Tools.
- In Microsoft Edge, go to Settings and more (…) icon > More Tools > Developer Tools.
- In Safari for Mac, first go to Safari > Preferences > Advanced > Show Develop menu in menu bar, then go to Develop > Show JavaScript Console.
When you open the browser’s developer tools, it displays a console window that shows error messages that may help to diagnose problems, particularly with code templates. For example, in Chapter 10, you learned how to edit the simple Leaflet map template in GitHub. If you accidentally make a mistake, such as deleting the comma between the latitude and longitude coordinates for map center, your code will “break” and display an empty gray box in your screen. If you turn on the browser developer tools, as shown in Figure A.2, the console will display several errors, including one that points you to a problem beginning in the index.html file on line 29. While the error does not specifically state that a comma is missing in line 30, it’s still the best clue to alert you to a problem in that vicinity of the code. This is just one way to use the developer tools, so explore other features to learn more about its many features, and how they differ across browsers.
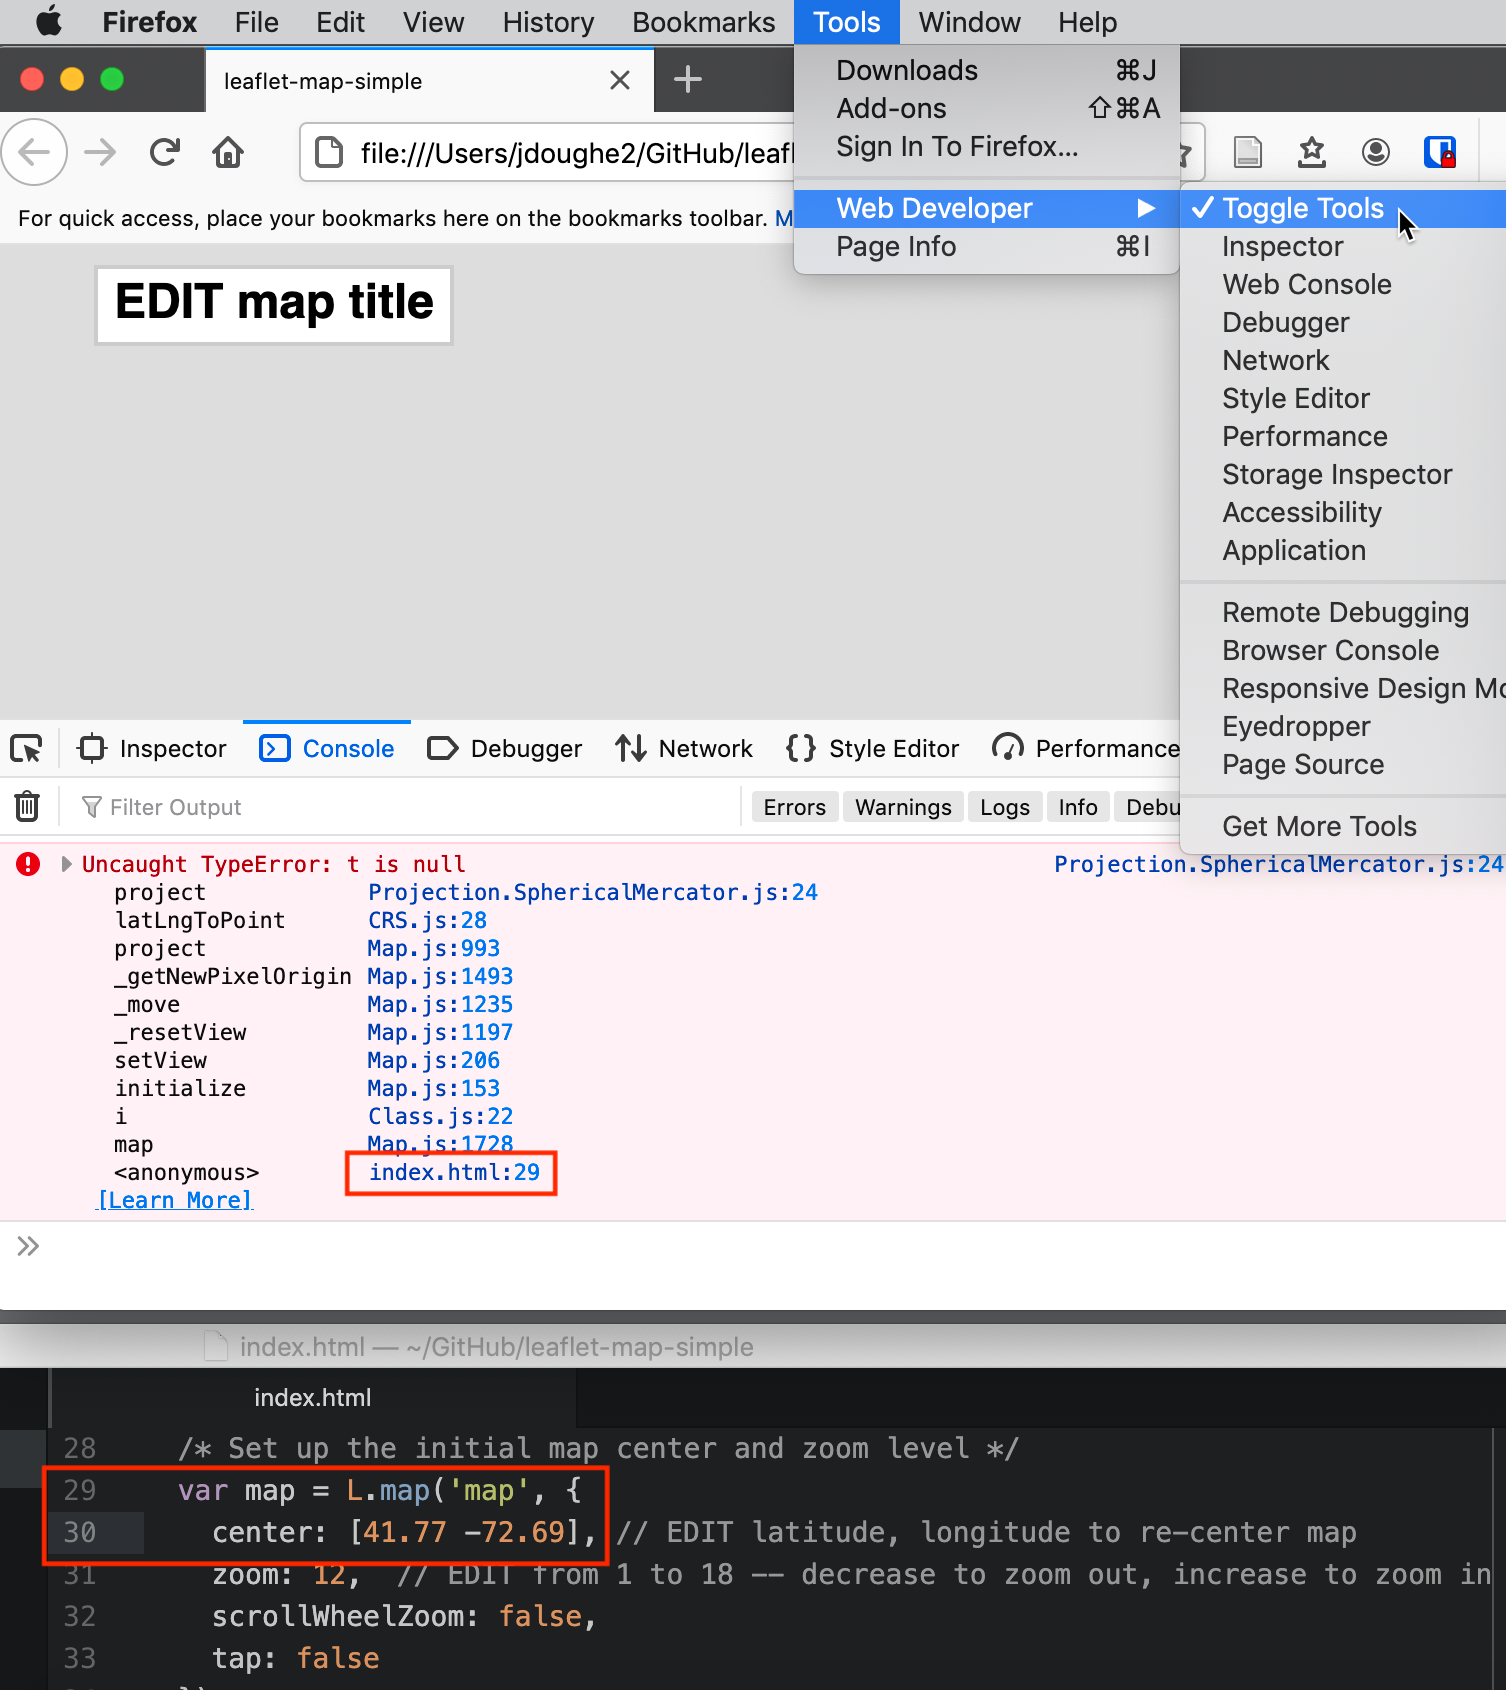
Figure A.2: When you open a browser’s developer tools, the console window will display any errors it flags in the code for that web page. In this example, a “broken” map appears as a gray box (top), and the console shows an error in line 29 of the index.html file (middle), which offers a clue about a missing comma between the latitude and longitude coordinates in line 30 (bottom).