#StandWithUkraine - Stop the Russian invasion
Join us and donate. Since 2022 we have contributed over $5,000 in book royalties to Save Life in Ukraine & Ukraine Humanitarian Appeal & The HALO Trust, and we will continue to give!
Copy, Edit, and Host a Simple Leaflet Map Template
Now that you understand how GitHub code repositories are like a public cookbook of recipes, which anyone can copy and modify, let’s get into the kitchen and start baking! In this section, we’ll introduce you to a very simple code template based on Leaflet, an open-source code library for creating interactive maps that are very popular in journalism, business, government, and higher education. Many people choose Leaflet because the code is freely available to everyone, relatively easy to use, and has an active community of supporters who regularly update it. But unlike drag-and-drop tools that we previously covered in Chapter 7: Map Your Data, working with our Leaflet templates requires you to copy and edit a few lines of code before hosting it on the web. While no prior coding experience is necessary, it’s helpful to know that these code templates as based on the three core languages that communicate with browsers: HyperText Markup Language (HTML), Cascading Style Sheets (CSS), and JavaScript. Furthermore, we can edit these code templates using the GitHub web interface, which means you can do this on any type of computer (Mac, Windows, Chromebook, etc.) with any modern web browser.
Here’s an overview of the key steps you’ll learn about GitHub in this section:
- Make a copy of our simple Leaflet map code template
- Edit the map title, start position, background layer, and marker
- Host a live online version of your modified map code on the public web
Your goal is to create your own version of this simple interactive map, with your edits, as shown in Figure 10.1.
Figure 10.1: Create your own version of this simple interactive Leaflet map.
- Create your own free account on GitHub. It may ask you to do a simple quiz to prove you’re a human! If you don’t see a confirmation message in your email, check your spam folder.
Tip: Choose a GitHub username that’s relatively short, and one that you’ll be happy seeing in the web address of charts and maps you’ll publish online. In other words, DrunkBrownieChef6789 may not be the wisest choice for a username, if BrownieChef is also available.
After you log into your GitHub account in your browser, go to our simple Leaflet map template at https://github.com/HandsOnDataViz/leaflet-map-simple
Click the green Use this template button to make your own copy of our repo, as shown in Figure 10.2.
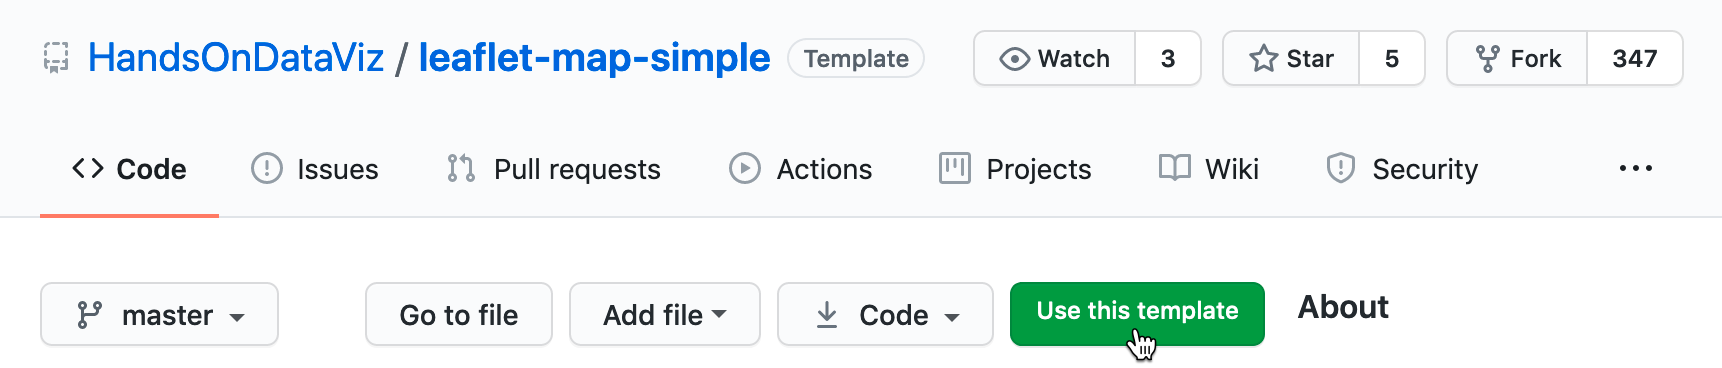
Figure 10.2: Click Use this template to make your own copy.
- On the next screen, your account will appear as the owner. Name your copy of the repo
leaflet-map-simple, the same as ours, as shown in Figure 10.3. Click the green Create repository from template button.
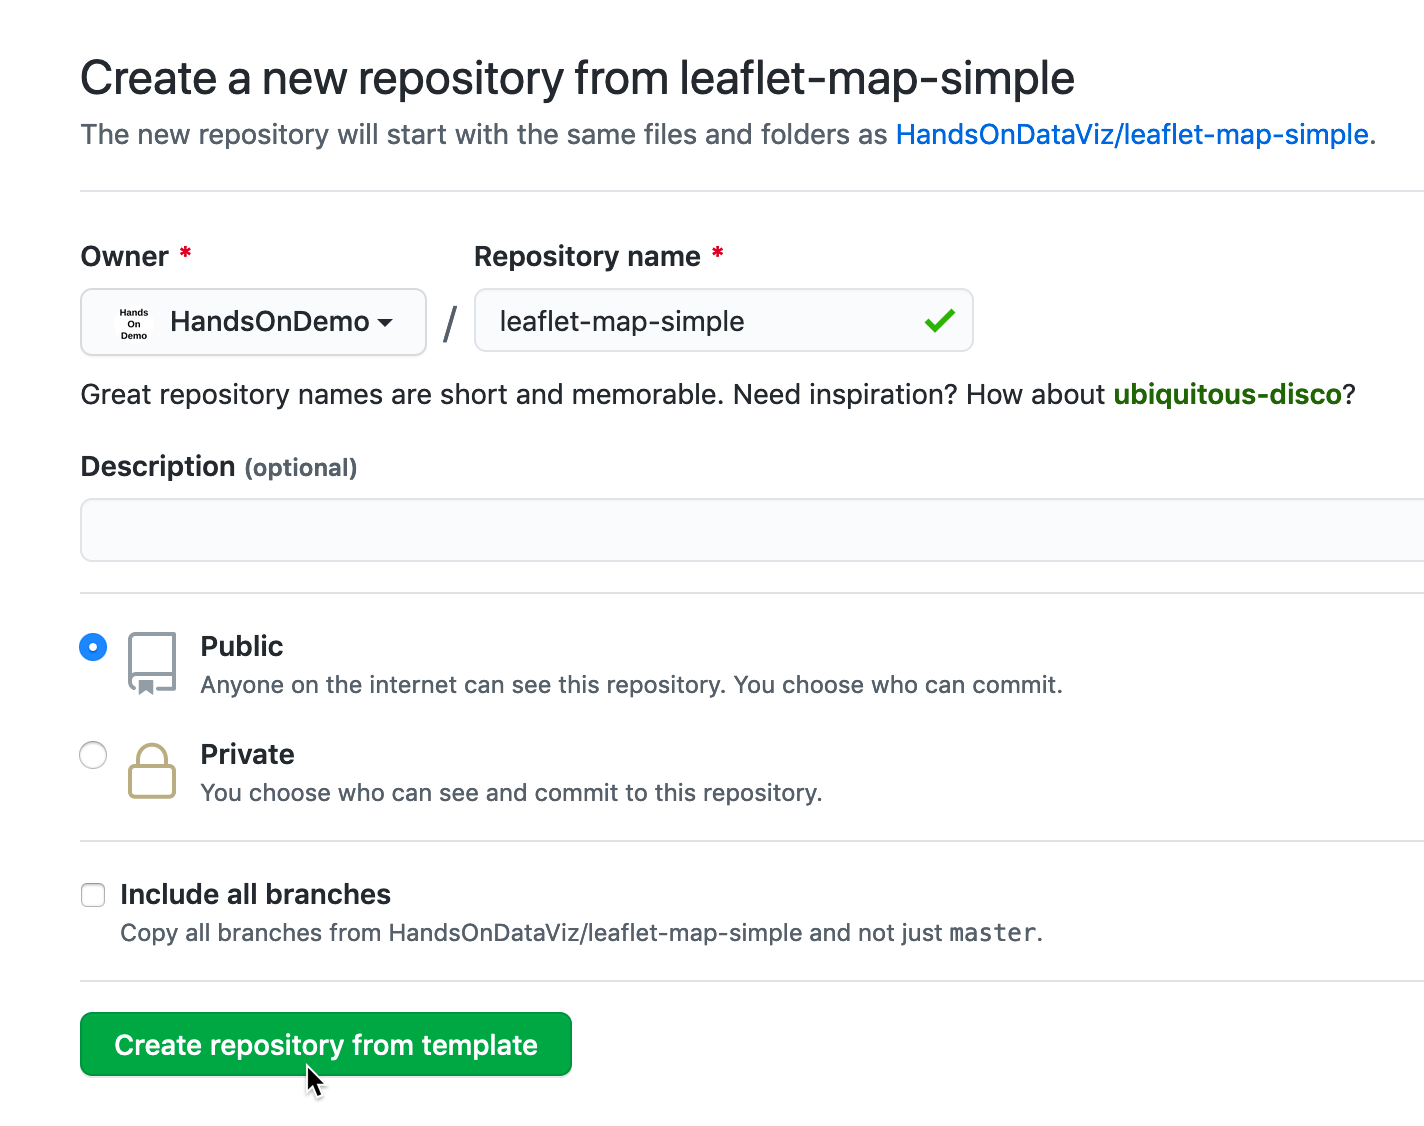
Figure 10.3: Name your copied repo leaflet-map-simple.
Note: We set up our repo using GitHub’s template feature to make it easier for users to create their own copies. If you’re trying to copy someone else’s GitHub repo and don’t see a Template button, then click the Fork button, which makes a copy a different way. Here’s the difference: Template allows you to make multiple copies of the same repo by giving them different names, while Fork allows you to create only one copy of a repo because it uses the same name as the original, and GitHub prevents you from creating two repos with the same name. If you need to create a second fork of a GitHub repo, go to the Create a New Repo and Upload Files on GitHub section of this chapter.
The upper-left corner of the next screen will say USERNAME/leaflet-map-simple generated from HandsOnDataViz/leaflet-map-simple, where USERNAME refers to your GitHub account username. This confirms that you copied our template into your GitHub account, and it contains only three files:
LICENSEshows that we’ve selected the MIT License, which allows anyone to copy and modify the code as they wish.README.mdprovides a simple description and link to the live demo, which we’ll come back to later.index.htmlis the key file in this particular template, because it contains the map code.
- Click on the
index.htmlfile to view the code, as shown in Figure 10.4.
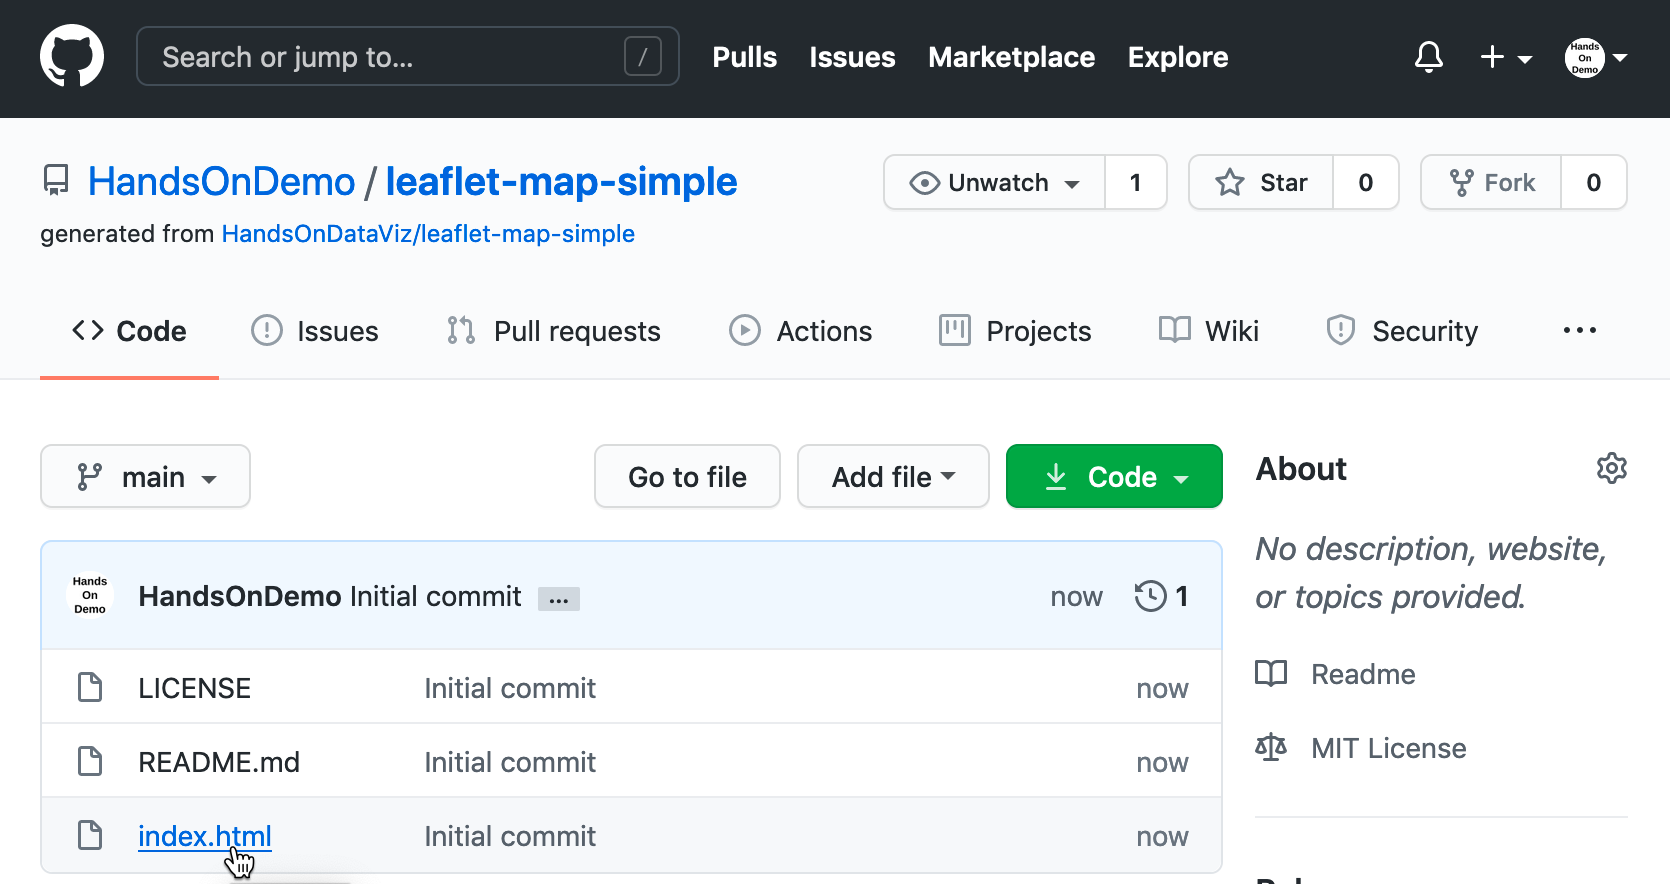
Figure 10.4: Click the index.html file to view the code.
If this is the first time you’re looking at computer code, it may feel overwhelming, but relax! We’ve inserted several “code comments” to explain what’s happening. The first block tells web browsers which formatting to apply to the rest of the page of code. The second block instructs the browser to load the Leaflet code library, the open-source software that constructs the interactive map. The third block describes where the map and title should be positioned on the screen. The good news is that you don’t need to touch any of those blocks of code, so leave them as-is. But you do want to modify a few lines further below.
- To edit the code, click on the the pencil symbol in the upper-right corner, as shown in Figure 10.5.
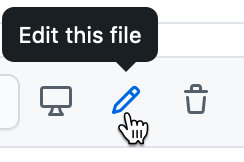
Figure 10.5: Click the pencil button to edit the code.
Let’s start by making one simple change to prove to everyone that you’re now editing your map, by modifying the map title, which appears in the HTML division tag block around lines 21-23.
In this line
<div id="map-title">EDIT your map title</div>, type your new map title in place of the wordsEDIT your map title. Be careful not to erase the HTML tags that appear on both ends inside the< >symbols.To save your edit, scroll to the bottom of the page and click the green Commit Changes button, as shown in Figure 10.6.
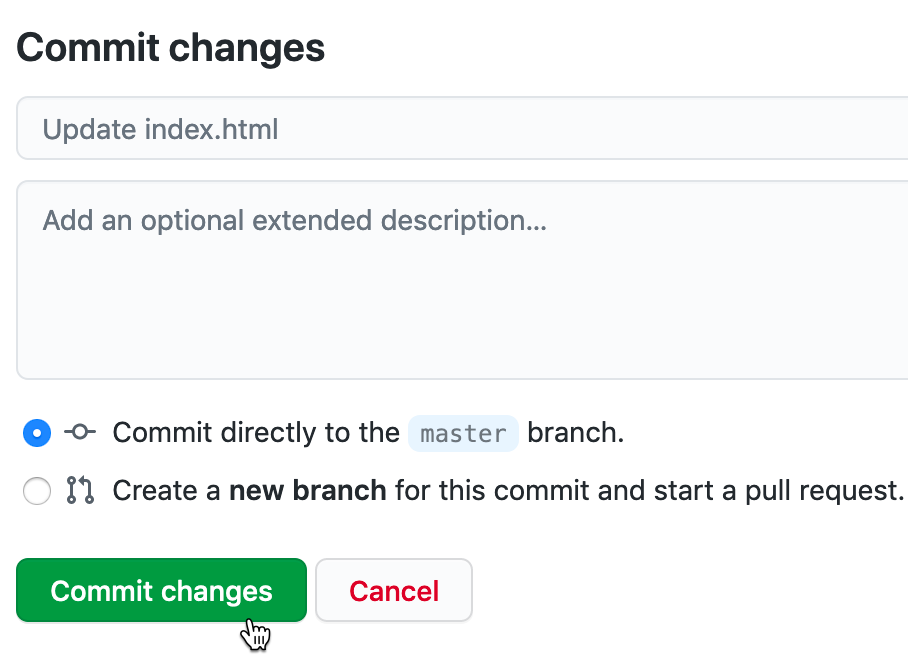
Figure 10.6: Click the green Commit Changes button to save your edits.
In the language of coders, we “commit” our changes in the same way that most people “save” a document, and later you’ll see how GitHub tracks each code commit so that you can roll them back if needed. By default, GitHub inserts a short description of your commit as “Update index.html”, and you have the option to customize that description when you start making lots of commits to keep track of your work. Also, GitHub commits your changes directly to the default branch of your code, which we’ll explain later.
Now let’s publish your edited map to the public web to see how it looks in a web browser. GitHub not only stores open-source code, but its built-in GitHub Pages feature allows you to host a live online version of your HTML-based code, which anyone with the web address can view in their browser. While GitHub Pages is free to use, there are some restrictions on usage, file size, and content and it is not intended for running an online business or commercial transactions. But one advantage of code templates is that you can host them on any web server you control. Since we’re already using GitHub to store and edit our code template, it’s easy to turn on GitHub Pages to host it online.
Tip: If you wish to store your code on GitHub but need to scale up to a larger commercial-level web host, see freemium services such as Netlify, which automatically detects any changes you push to your GitHub repository, then deploys them to your online site.
- To access GitHub Pages, scroll to the top of your repo page and click the Settings button as shown in Figure 10.7.
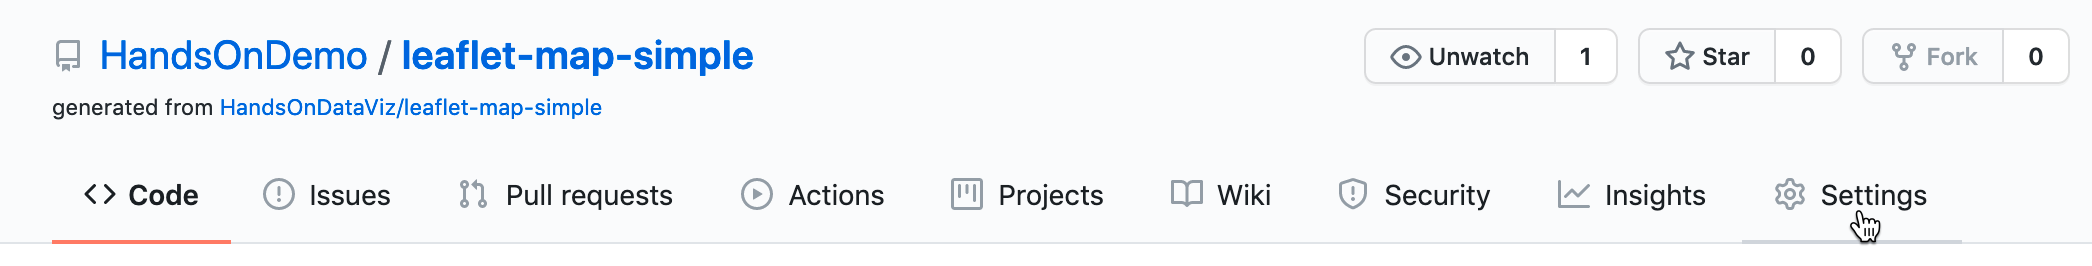
Figure 10.7: Click the Settings button to access GitHub Pages and publish your work on the web.
- In the Settings screen, navigate to Pages tab from the left-hand side menu. In the Pages tab, change Source from None to main, keep the default /(root) option in the middle, and press Save as shown in Figure 10.8. This step tells GitHub to publish a live version of your map on the public web, where anyone can access it in their browser, if they have the web address.
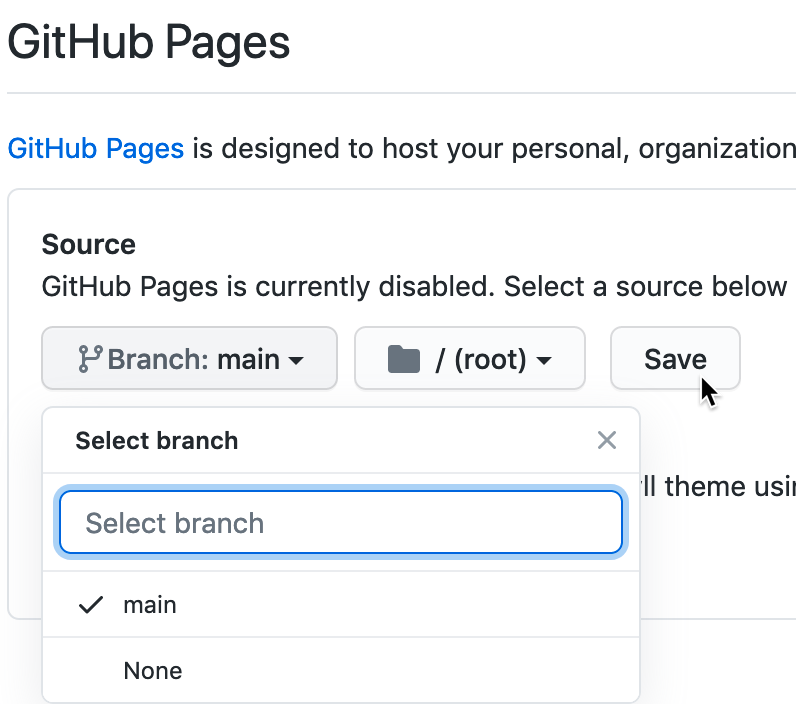
Figure 10.8: In Settings, go to GitHub Pages, and switch the source from None to Main.
Tip: In response to the Black Lives Matter movement in 2020, GitHub renamed its default branch from master to main to eliminate the master-slave metaphor commonly used in computer science.
- The page will automatically refresh, and you should see the web address where your live map has been published online. Right-click the link and open it in the new browser tab, as shown in Figure 10.9.
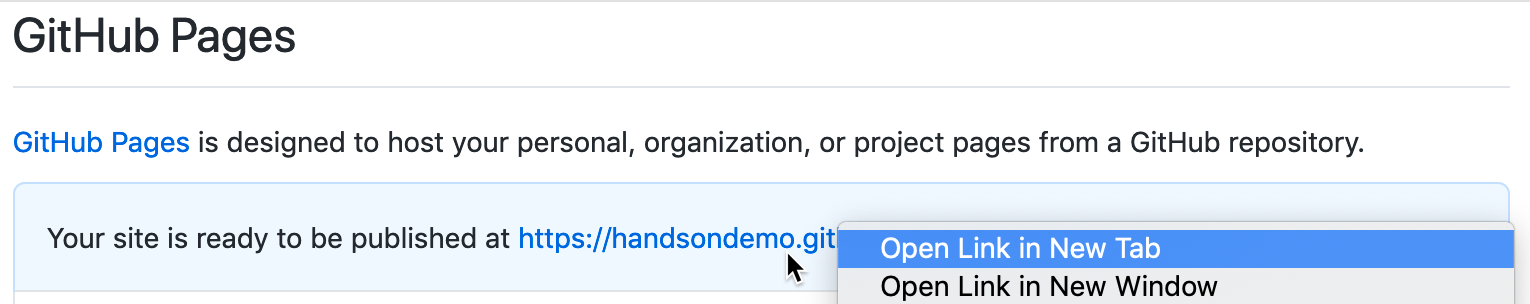
Figure 10.9: In Settings for GitHub Pages, right-click your published map link to open in a new tab.
Now you should have at least two tabs open in your browser. The first tab contains your GitHub repo, where you edit your code, with a web address in this format, and replace USERNAME and REPOSITORY with your own:
https://github.com/USERNAME/REPOSITORY
The second tab contains your GitHub Pages live website, where your edited code appears online. GitHub Pages automatically generates a public web address in this format:
https://USERNAME.github.io/REPOSITORY
Note: The live version of your code points to the index.html page by default, so it’s not necessary to include it in the web address.
Remember how we told you not to create your account with a username like DrunkBrownieChef6789? GitHub automatically places your username automatically in the public web address.
Keep both tabs open so you can easily go back and forth between editing your code and viewing the live results online.
Tip: GitHub Pages usually displays your live map in less than 30 seconds, but in some cases it may require several minutes. If you see no change after one minute, give your browser a “hard refresh” to bypass any saved content in your cache and re-download the entire web page from the server, using one of these key combinations:
- Ctrl + F5 (most browsers for Windows or Linux)
- Command + Shift + R (Chrome or Firefox for Mac)
- Shift + Reload button toolbar (Safari for Mac)
- Ctrl + Shift + Backspace (on Chromebook)
Now let’s edit your the GitHub repo so that the link points to your live map, instead of our live map.
Copy the web address of your live map from your second browser tab.
Go back to your first browser tab with your GitHub repo, and click on the repo title to return to its home page, as shown in Figure 10.10.
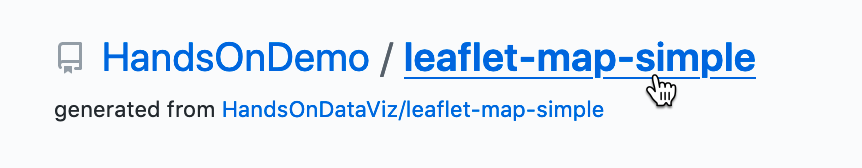
Figure 10.10: On your first browser tab, click the repo title.
- On your repo page, click to open the
README.mdfile, and click the pencil again to edit it, as shown in Figure 10.11. Paste your live web link under the label (replace with link to your site) and scroll down to commit the change.
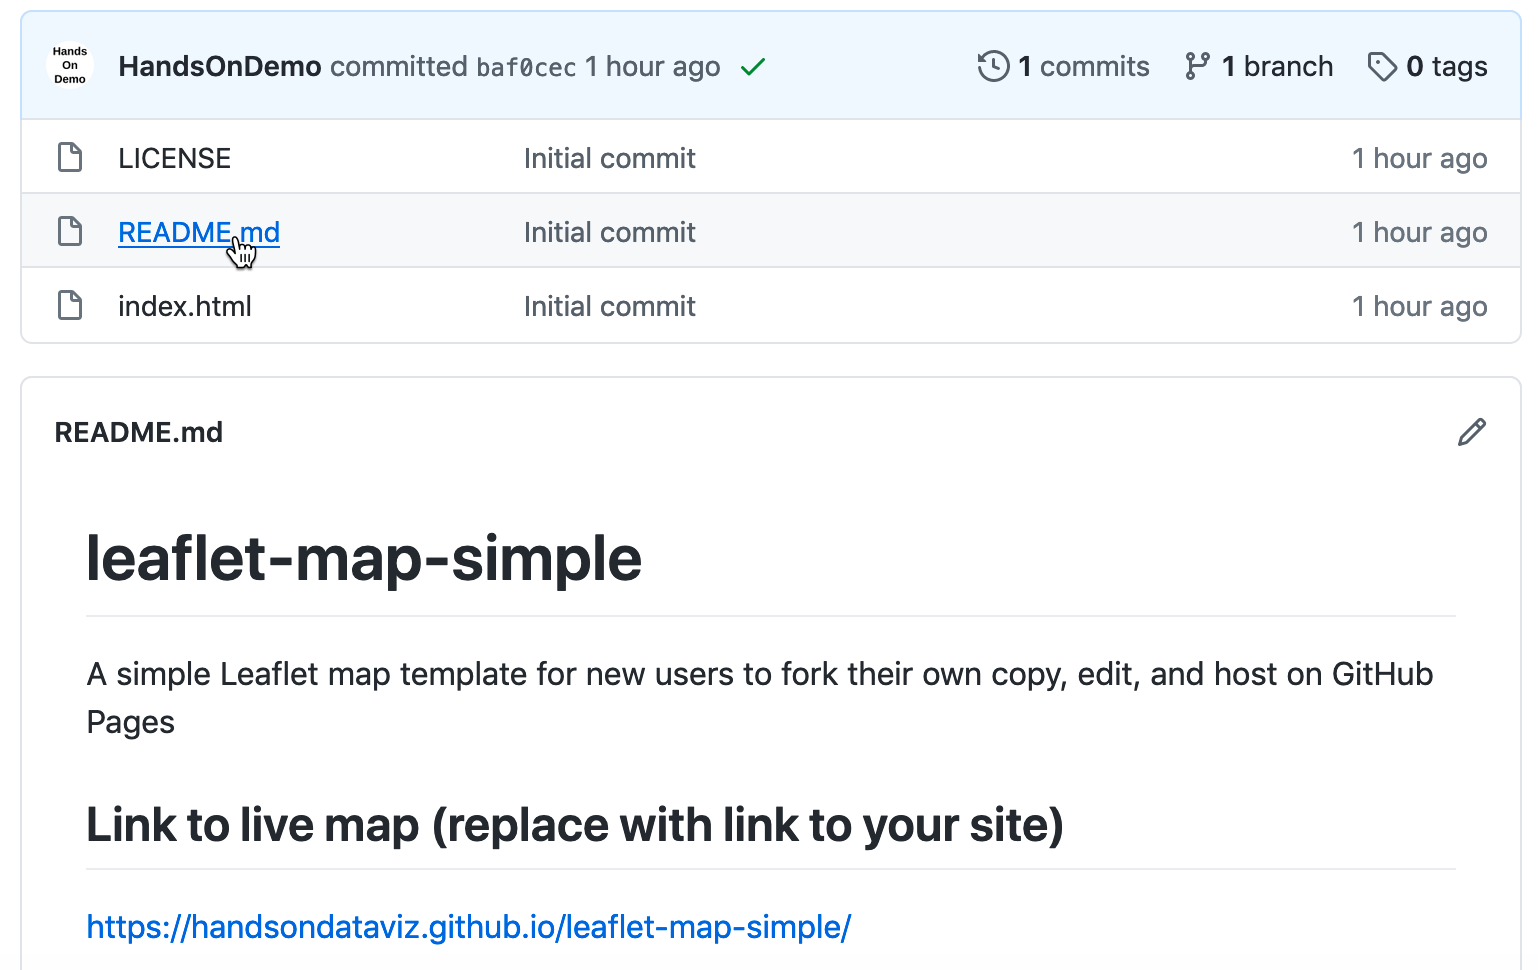
Figure 10.11: Open and edit the README file to paste the link to your live map.
Now that you’ve successfully made simple edits and published your live map, let’s make more edits to jazz it up and help you learn more about how Leaflet code works.
- On your repo home page, click to open the
index.htmlfile, and click the pencil symbol to edit more code.
Wherever you see the EDIT code comment, this points out a line that you can easily modify. For example, look for the code block shown below that sets up the initial center point of the map and its zoom level. Insert a new latitude and longitude coordinate to set a new center point. To find coordinates, right-click on any point in Google Maps and select What’s here?, as described in the geocoding section in Chapter 2.
  var map = L.map('map', {
    center: [41.77, -72.69], // EDIT coordinates to re-center map
    zoom: 12,  // EDIT from 1 (zoomed out) to 18 (zoomed in)
    scrollWheelZoom: false,
    tap: false
  });
The next code block displays the basemap tile layer that serve as the map background. Our template uses a light map with all labels, publicly provided by CARTO, with credit to OpenStreetMap. One simple edit is to change light_all to dark_all, which will substitute a different CARTO basemap with inverted coloring. Or preview several other Leaflet basemap code options that you can copy and paste. Make sure to attribute the source, and also keep }).addTo(map); at the end of this code block, which displays the basemap.
L.tileLayer(
'https://{s}.basemaps.cartocdn.com/light_all/{z}/{x}/{y}{r}.png', {
attribution: '© <a href="https://osm.org/copyright">\
OpenStreetMap</a> contributors, ©\
<a href="https://carto.com/attribution">CARTO</a>'
}).addTo(map);The last code block displays a single point marker on the map, colored blue by default in Leaflet, with a pop-up message when users click it. You can edit the marker coordinates, insert the pop-up text, or copy and paste the code block to create a second marker.
L.marker([41.77, -72.69]).addTo(map) // EDIT marker coordinates
.bindPopup("Insert pop-up text here"); // EDIT pop-up text message
Warning: Be careful when editing your code. Accidentally removing or adding extra punctuation (such as quotation marks, commas, or semicolons) can stop your map from working. But breaking your code—and fixing it—can also be a great way to learn.
- After making edits, remember to scroll down and press the Commit button to save changes. Then go to your browser tab with the live map, and do a “hard refresh” to view changes. Edits to your map normally will appear within 30 seconds, but remember that GitHub Pages sometimes requires longer to process code commits. If you have problems, see the Fix Common Problems section in the appendix.
Congratulations! If this is the first time that you’ve edited computer code and hosted it online, you can now call yourself a “coder”. The process is similar to following and modifying a cookbook recipe, just like you also can call yourself a “chef” after baking your first batch of brownies! Although no one is likely to hire you as a full-time paid coder (or chef) at this early stage, you now understand several of the basic skills needed to copy, edit, and host code online, and you’re ready to dive into the more advanced versions, such as Chart.js and Highcharts templates in Chapter 11 and Leaflet map templates in Chapter 12.