#StandWithUkraine - Stop the Russian invasion
Join us and donate. Since 2022 we have contributed over $5,000 in book royalties to Save Life in Ukraine & Ukraine Humanitarian Appeal & The HALO Trust, and we will continue to give!
Chapter 4 Clean Up Messy Data
More often than not, datasets will be messy and hard to visualize right away. They will have missing values, dates in different formats, text in numeric-only columns, multiple items in the same columns, various spellings of the same name, and other unexpected things. See Figure 4.1 for inspiration. Don’t be surprised if you find yourself spending more time cleaning up data than you do analyzing and visualizing it.
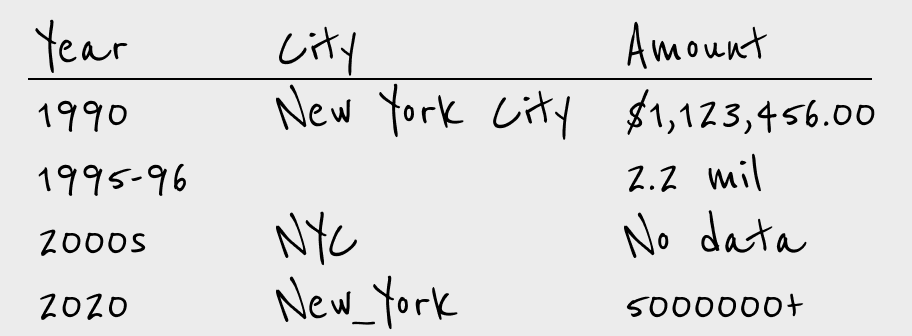
Figure 4.1: More often than not, raw data looks messy.
In this chapter you’ll learn about different tools, in order to help you make decisions about which one to use to clean up your data efficiently. First, we’ll start with basic cleanup methods using Google Sheets, such as its Smart Cleanup feature to fix inconsistent data and remove duplicates, find and replace with a blank, tranpose rows and columns of data, split data into separate columns, combine columns into one, and convert numbers to text and remove characters. While we feature Google Sheets in our examples, many of these principles (and in some cases the same formulas) apply to Microsoft Excel, LibreOffice Calc, Mac’s Numbers, or other spreadsheet packages. Next, you will learn how to extract table data from text-based PDF documents with Tabula, a free tool used by data journalists and researchers worldwide to analyze spending data, health reports, and all sorts of other datasets that get trapped in PDFs. Finally, we will introduce OpenRefine, a powerful and versatile tool to clean up the messiest spreadsheets, such as those containing dozens of different spellings of the same name.