#StandWithUkraine - Stop the Russian invasion
Join us and donate. Since 2022 we have contributed over $5,000 in book royalties to Save Life in Ukraine & Ukraine Humanitarian Appeal & The HALO Trust, and we will continue to give!
Draw and Edit with GeoJson.io
GeoJson.io is a popular open-source web tool to convert, edit, and create GeoJSON files. The tool was originally developed by Tom MacWright in 2013 and quickly became a go-to tool for geospatial practitioners.
In this tutorial, we will show you how to convert existing KML, GPX, TopoJSON, and even CSV files with latitude/longitude data into GeoJSON files. We will also explore how to edit attribute data, add new features to GeoJSON files, and create new geodata from scratch by tracing satellite imagery.
Convert KML, GPX, and other formats into GeoJSON
Navigate to the GeoJson.io tool. You will see a map on the left, and a Table/JSON attribute view area on the right. At the start, it represents an empty feature collection. Remember that features are points, polylines, and polygons.
Drag and drop your geospatial data file into the map area on the left. Alternatively, you can also import a file from Open > File menu. If you don’t have a geospatial file, download the Toronto neighborhoods sample file in KML format to your computer, and upload it to the GeoJson.io tool. This simplified sample KML file was created from the Toronto Open Data portal.
If GeoJson.io can recognize and import your geodata file, you will see a green popup message in the upper-left corner saying how many features were imported. For example, Figure 13.4 shows us that 140 features were imported from the sample Toronto neighborhoods KML file, and these polygons appear in the top of the map view.
Note: If GeoJson.io cannot import your file, you will see a red popup saying it “Could not detect file type.” Instead, try to convert your file into GeoJSON format using the Mapshaper tool, as described further below.
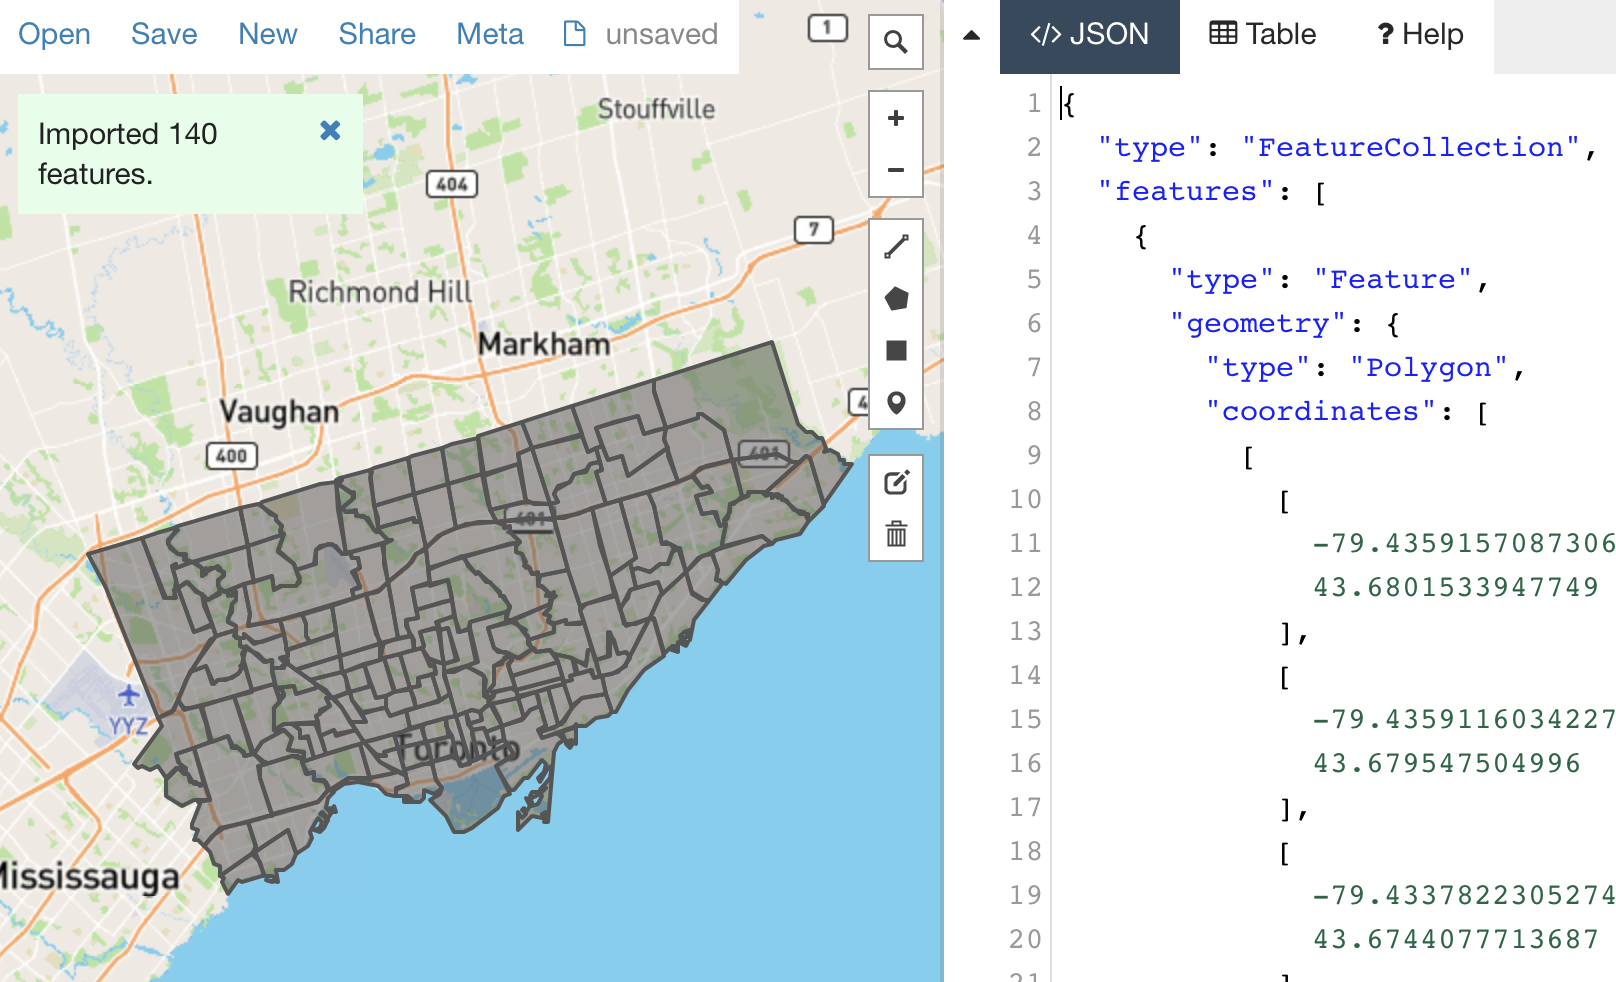
Figure 13.4: GeoJson.io successfully imported the Toronto neighborhoods sample KML file.
To download a converted GeoJSON file to your computer, go to Save > GeoJSON.
Warning: The GeoJson.io tool will automatically name your downloaded file as map.geojson, so rename it to avoid confusion.
Create GeoJSON from a CSV file
GeoJson.io can transform a CSV spreadsheet with latitude (or lat) and longitude (or lon) columns into a GeoJSON file of point features. Each row in the spreadsheet becomes its own point, and all columns other than lat and lon become attributes (or properties) of point features. For this exercise, you can download the Toronto locations sample CSV file to your computer, which contains three rows of data as shown in Figure 13.5.
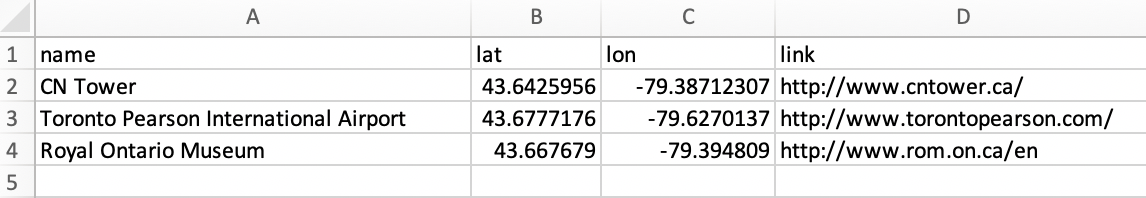
Figure 13.5: A CSV spreadsheet with lat/lon columns can be transformed into a GeoJSON with point features.
- Select New to clear data from the prior exercise in the GeoJson.io tool, then drag-and-drop the Toronto locations CSV file you downloaded above into the map area of the tool. A green popup show notify you that 3 features were successfully imported.
Note: If you add new data to existing data in GeoJson.io, it will combine them into one file, which can be useful for certain tasks.
Click on a marker to see a popup with point properties. If you used the Toronto locations sample file, you will see name and link features, in addition to the tool’s default marker-color, marker-size, and marker-symbol fields. Note that you can edit and delete properties in the Map view.
Click the Table tab to the right of the map to view all of the data at once, rather than individual marker popups, as shown in Figure 13.6. You can edit and delete properties in the Table view, as well as the JSON code view.
If you edited your map data, go to Save > GeoJSON to download the file to your computer, which will automatically be named
map.geojson, so rename it to avoid confusion. Optionally, you can also log into GeoJson.io with your GitHub account and save it directly to your repository.
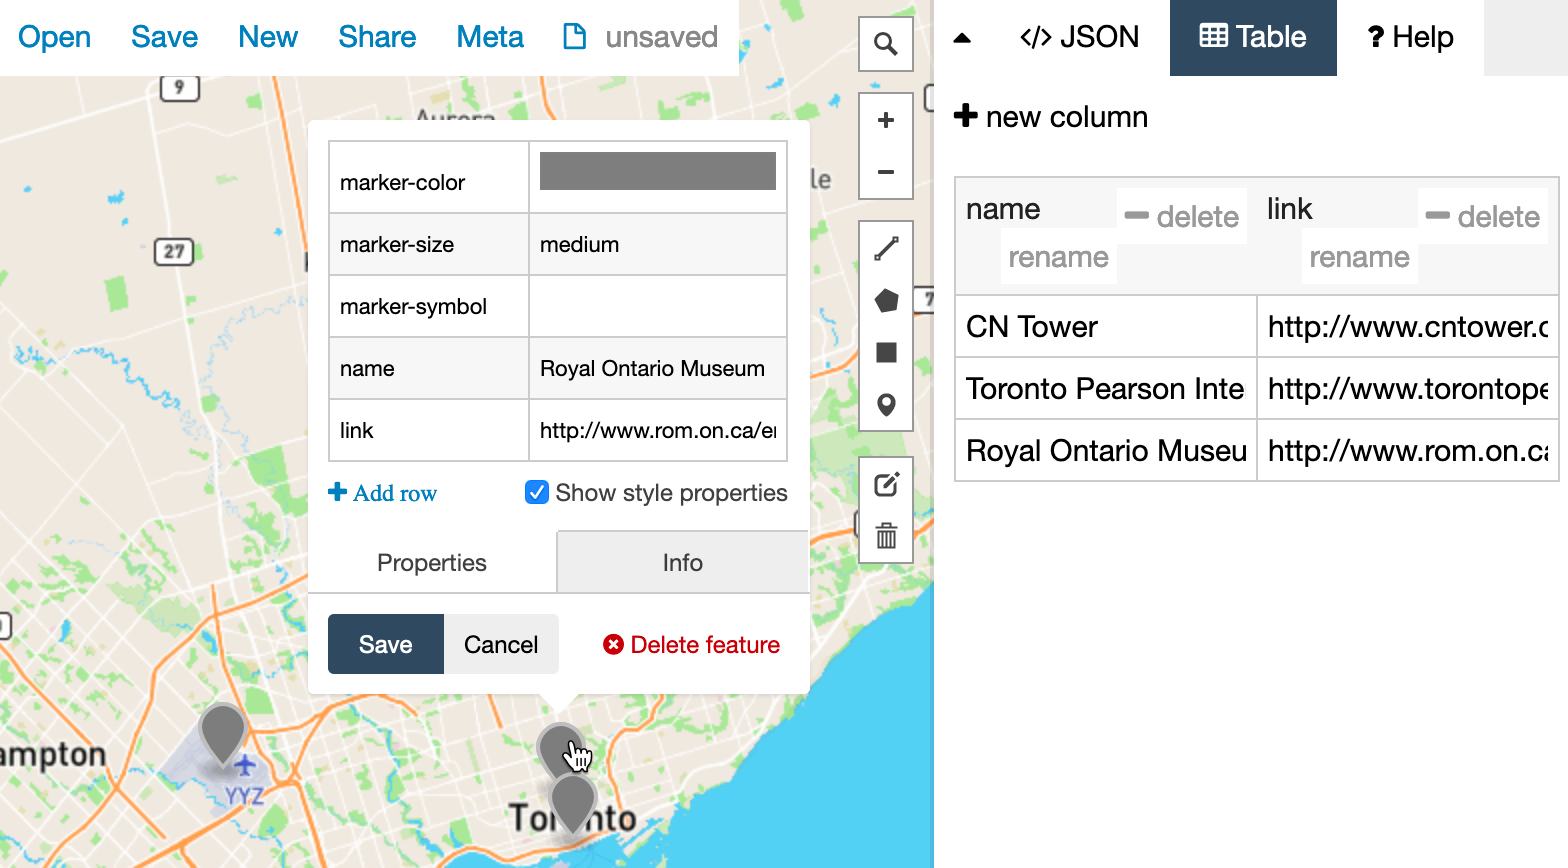
Figure 13.6: Upload CSV data into GeoJson.io to easily edit it in the Map or Table view.
Create new GeoJSON data with drawing tools
GeoJson.io lets you create geospatial files from scratch by using simple drawing tools to place points, polylines, or polygons on the map. These are useful when you have no original file to work with. Let’s create some new data.
Click New to clear data from the prior exercise in the GeoJson.io tool.
In the lower-left corner, switch from Mapbox (vector tiles) to Satellite (raster data).
In the upper-right corner of the map, use the Search tool to find an area of interest. For this exercise, we will trace the geography around an athletic field in Toronto, as shown in Figure 13.7.
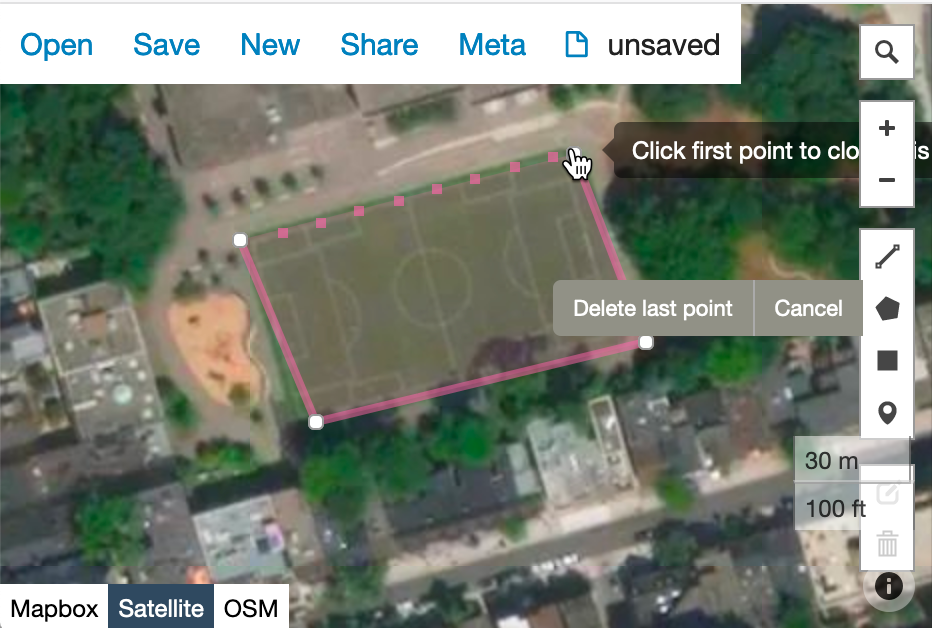
Figure 13.7: Use drawing tools to create points, lines, and polygons in GeoJson.io.
In the toolbar, you have a choice of four drawing tools: a polyline (which is a series of points connected by lines, but not closed like a polygon), a polygon, a rectangle (which is just an instance of a polygon), and a point marker.
Select the Draw a marker button, and click anywhere on the map to place it. You will see a gray marker that is now part of your map. You can modify its properties, or delete it in the interactive pop-up.
Select the Draw a polyline button and click on multiple locations in the map to see connected lines appearing. Polylines are generally used for roads and paths. To finish and create a feature, click again on the final point.
Select the Draw a polygon button, which similar to drawing a polyline, except that you need to complete the feature by making your final point at the same location as your initial point. Polygons are used to define boundaries, including small and large geographical areas.
Use the Edit layers tool (above Delete) to move a marker to a better position, or adjust the shapes of your features.
After you have created features and their physical boundaries, add meaningful attribution data. Use the interactive popups or the Table view to give objects names and other properties. When finished, save the GeoJSON file to your computer.
You can also use drawing tools to edit existing GeoJSON files. For example, if you created a GeoJSON from a CSV file, you might decide to move some markers with Edit layers tool instead of modifying their latitude and longitude values. Or you might decide to make polygons more precise by tracing around satellite imagery.
In the next section, we will introduce Mapshaper, another free online tool to convert and modify geospatial files.