#StandWithUkraine - Stop the Russian invasion
Join us and donate. Since 2022 we have contributed over $5,000 in book royalties to Save Life in Ukraine & Ukraine Humanitarian Appeal & The HALO Trust, and we will continue to give!
Chapter 7 Map Your Data
Maps draw your readers into data that includes a spatial dimension, while also developing a stronger sense of place. Seeing the relative distance between points on a map, or identifying geographic patterns in a choropleth map (where colored polygons represent data values), relays information to readers’ eyes more effectively than text, tables, or charts. But creating meaningful maps that draw our attention to key insights in your data requires clear thinking about design choices.
In this chapter, we will examine principles of map design and distinguish between good and bad maps. You will learn about rules that apply to all maps, and specific guidelines for creating choropleth maps. While many tools allow you to download maps as static images, our book also demonstrates how to construct interactive charts that invite readers to zoom in and explore the data in their web browsers. Later you’ll learn how to embed interactive charts on your website in Chapter 9.
Decisions about map types are based on two main factors: the format of your data, and the kind of story you wish to tell. Learn about different types of maps you can create in this book in Table 7.1. For example, point maps work best to show specific locations with colored markers to represent categories (such as hospitals), while choropleth maps are best suited to display relative values for regions (such as birth rates across US states). After selecting your map type, follow our tool recommendations and step-by-step tutorials that appear in the sections that follow. This chapter features Easy Tools with drag-and-drop menus, such as Datawrapper, Google My Maps, Tableau Public, and the Socrata Open Data platform to create continually-updated maps. But the table also points you to Power Tools that give you more control to customize and host your visualizations, such as Leaflet code templates in Chapter 12. These advanced tools require prior knowledge on how to edit and host code templates with GitHub in Chapter 10.
| Map | Best use and tutorials in this book |
|---|---|
Locator point map with basic polygons |
Best to show specific places with custom markers and their location in regions. Easy tools: Locator Point Map with Datawrapper tutorial, or Google My Maps tutorial for grouped marker categories or custom marker images. Power tool: Ch 13: Leaflet Maps with Google Sheets tutorial |
Symbol point map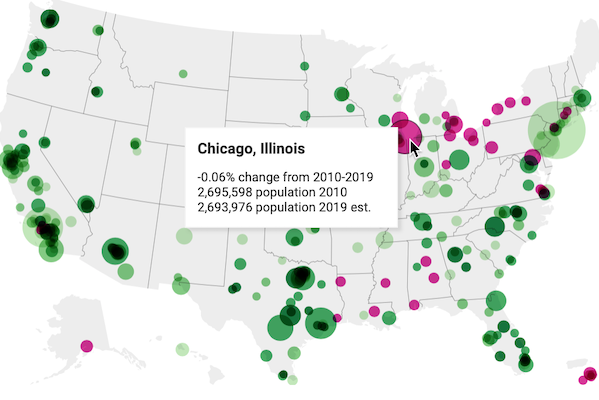 |
Best to show specific locations (such as cities), with variable-sized shapes or colors to represent data values (such as population growth). Easy tool: Symbol Point Map with Datawrapper tutorial |
Choropleth (colored polygon) map 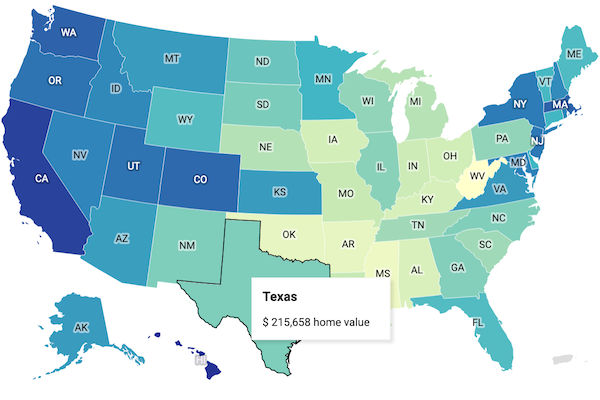 |
Best to show patterns across geographic areas (such as neighborhoods or nations) by coloring polygons to represent data values. Easy tool: Choropleth map with Datawrapper tutorial or Choropleth map with Tableau Public tutorial Power tools: Ch 13: Leaflet Maps with Google Sheets tutorial |
Heat point map 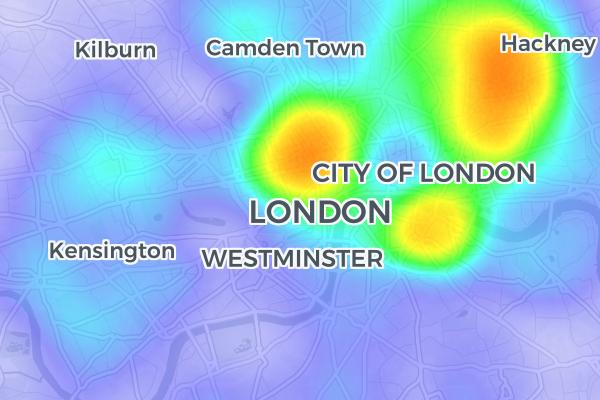 |
Best to show clusters of points as colored hotspots to emphasize high frequency or density of cases. Power tool: Ch 13: Leaflet Heatmap code template |
Story map 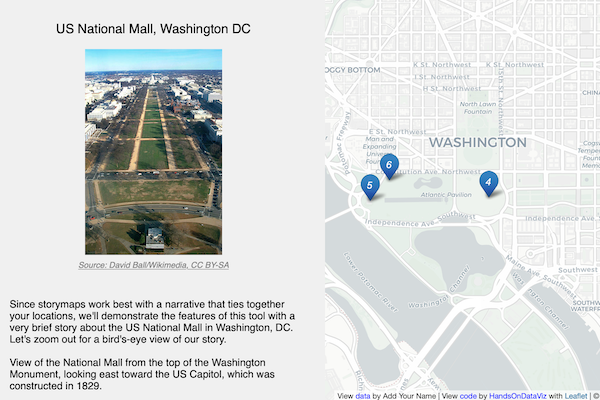 |
Best to show a point-by-point guided tour, with a scrolling narrative to display text, images, audio, video, and scanned map backgrounds. Power tool: Ch 13: Leaflet Storymaps with Google Sheets tutorial |
Polyline map 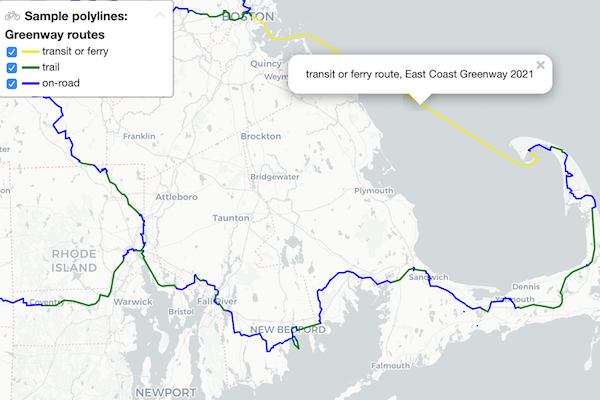 |
Best to show routes (such as trails or transit), with colors for different categories. Easy Tool: Google My Maps tutorial Power tool: Ch 13: Leaflet Maps with Google Sheets tutorial |
Customized point-polyline-polygon map 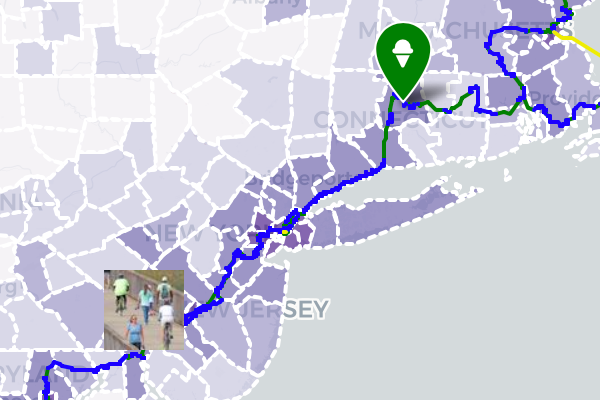 |
Best to show any combination of points, polylines, or polygons, with customized icons for categories, and colored regions to represent data values. Power tool: Ch 13: Leaflet Maps with Google Sheets tutorial |
Searchable point map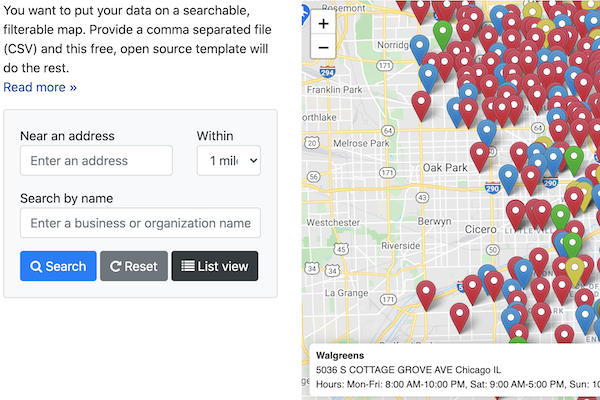 |
Best to show specific locations for users to search by name or proximity, or filter by category, with optional list view. Power Tool: Ch 13: Leaflet Searchable Point Map code template |
Current map from open-data repository |
Best to show the most current information pulled directly from an open-data repository such as Socrata and others. Easy tool: Current map with Socrata open data tutorial Power tool: Ch 13: Leaflet Maps with Open Data API code template |