#StandWithUkraine - Stop the Russian invasion
Join us and donate. Since 2022 we have contributed over $5,000 in book royalties to Save Life in Ukraine & Ukraine Humanitarian Appeal & The HALO Trust, and we will continue to give!
Transpose Rows and Columns
Sometimes you download good data, but your visualization tool requires you to transpose, or swap the rows and the columns, in order to create the chart or map you desire. This problem often arises when working with time-series or historical data, because they are treated in opposite ways in tables and charts. When designing a table, the proper method is to place dates horizontally as column headers, so that we read them from left-to-right, like this:20
| Year    | 2000 | 2010 | 2020 |
|---------|------|------|------|
| Series1 |  333 |  444 |  555 |
| Series2 |  777 |  888 |  999 |
But when designing a line chart in Google Sheets and similar tools, which you’ll learn in Chapter 6: Chart Your Data, we need to transpose the data so that dates run vertically down the first column, in order for the software to read them as labels for a data series, like this:
| Year | Series1 | Series2 |
|------|---------|---------|
| 2000 |     333 |     777 |
| 2010 |     444 |     888 |
| 2020 |     555 |     999 |
Learn how to transpose rows and columns in our sample data:
Open the Transpose sample data file in Google Sheets, sign in with your account, and go to File > Make a Copy to create a version you can edit in your Google Drive.
Select all of the rows and columns you wish to transpose, and go to Edit > Copy.
Scroll further down the spreadsheet and click on a cell, or open a new spreadsheet tab, and go to Edit > Paste Special > Paste Transposed, as shown in Figure 4.4.
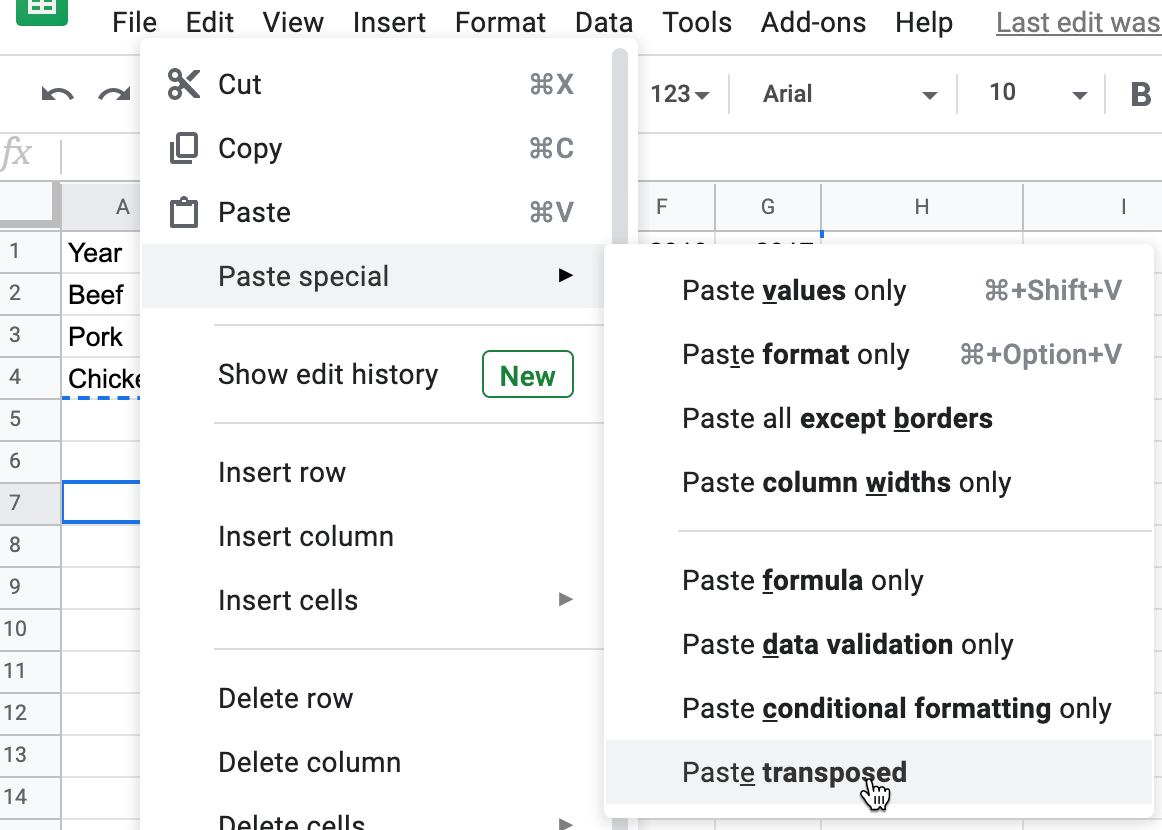
Figure 4.4: Go to Edit - Paste Special - Paste Transposed to swap rows and columns.
Tip: Google Sheets also provides a function, =transpose( -insert range- ), which, unlike Paste Special > Transpose, will prevent you from overwriting existing data in the spreadsheet.
Now that you know how to clean up data by transposing rows and columns, in the next section you’ll learn how to split data into separate columns.
Stephen Few, Show Me the Numbers: Designing Tables and Graphs to Enlighten, Second edition (Burlingame, CA: Analytics Press, 2012), p. 166↩︎