#StandWithUkraine - Stop the Russian invasion
Join us and donate. Since 2022 we have contributed over $5,000 in book royalties to Save Life in Ukraine & Ukraine Humanitarian Appeal & The HALO Trust, and we will continue to give!
Choropleth Map with Datawrapper
Now let’s pivot from point maps to polygon maps. Since you’ve already learned how to use Datawrapper to design charts and symbol maps, let’s use this tool to create a choropleth map, which looks like colored polygons. Choropleth maps work best when used to show patterns across geographic areas by coloring polygons to represent data values. Datawrapper offers a wide collection of common geographical boundaries, including world regions, states and provinces, and also hexagons (cartograms), counties, congressional districts, and census tracts for the United States.
In this section, you’ll create a choropleth map of typical home values for US states in August 2020 according to the Zillow Home Value Index, as shown in Figure 7.47. The index reflects typical home values (meaning those in the 35th to 65th percentile range, around the median) for single-family residences, condos, and co-ops, and it is smoothed and seasonally adjusted.
Figure 7.47: Choropleth map of 2020 home values in US states with Datawrapper. Explore the interactive version.
Datawrapper splits the process of creating a map into four steps: select map, add data, visualize, then publish and embed. To create your own choropleth map, follow this tutorial.
- Open the Home Value Index data in Google Sheets, which we downloaded from the Zillow research site. Read the notes to understand its origin and definitions.
Good maps often require cleaning up messy data as described in Chapter 4. In our spreadsheet we removed all of the columns except two, August 2019 and August 2020, and we also inserted a Percent Change column, which we calculated this way: (2020 - 2019) / 2019 * 100. Also, we’re fortunate that Datawrapper easily recognizes US state names and abbreviations.
In the Google Sheet, go to File > Make a copy to save your own version in your Google Drive, and Share it so that anyone can view it.
Open Datawrapper, click on Start Creating, then click the Create new…- New Map dropdown menu, and select Choropleth map as shown in Figure 7.48. No login is required to create a map, but you should sign up for a free account in order to save your work and publish your map online.
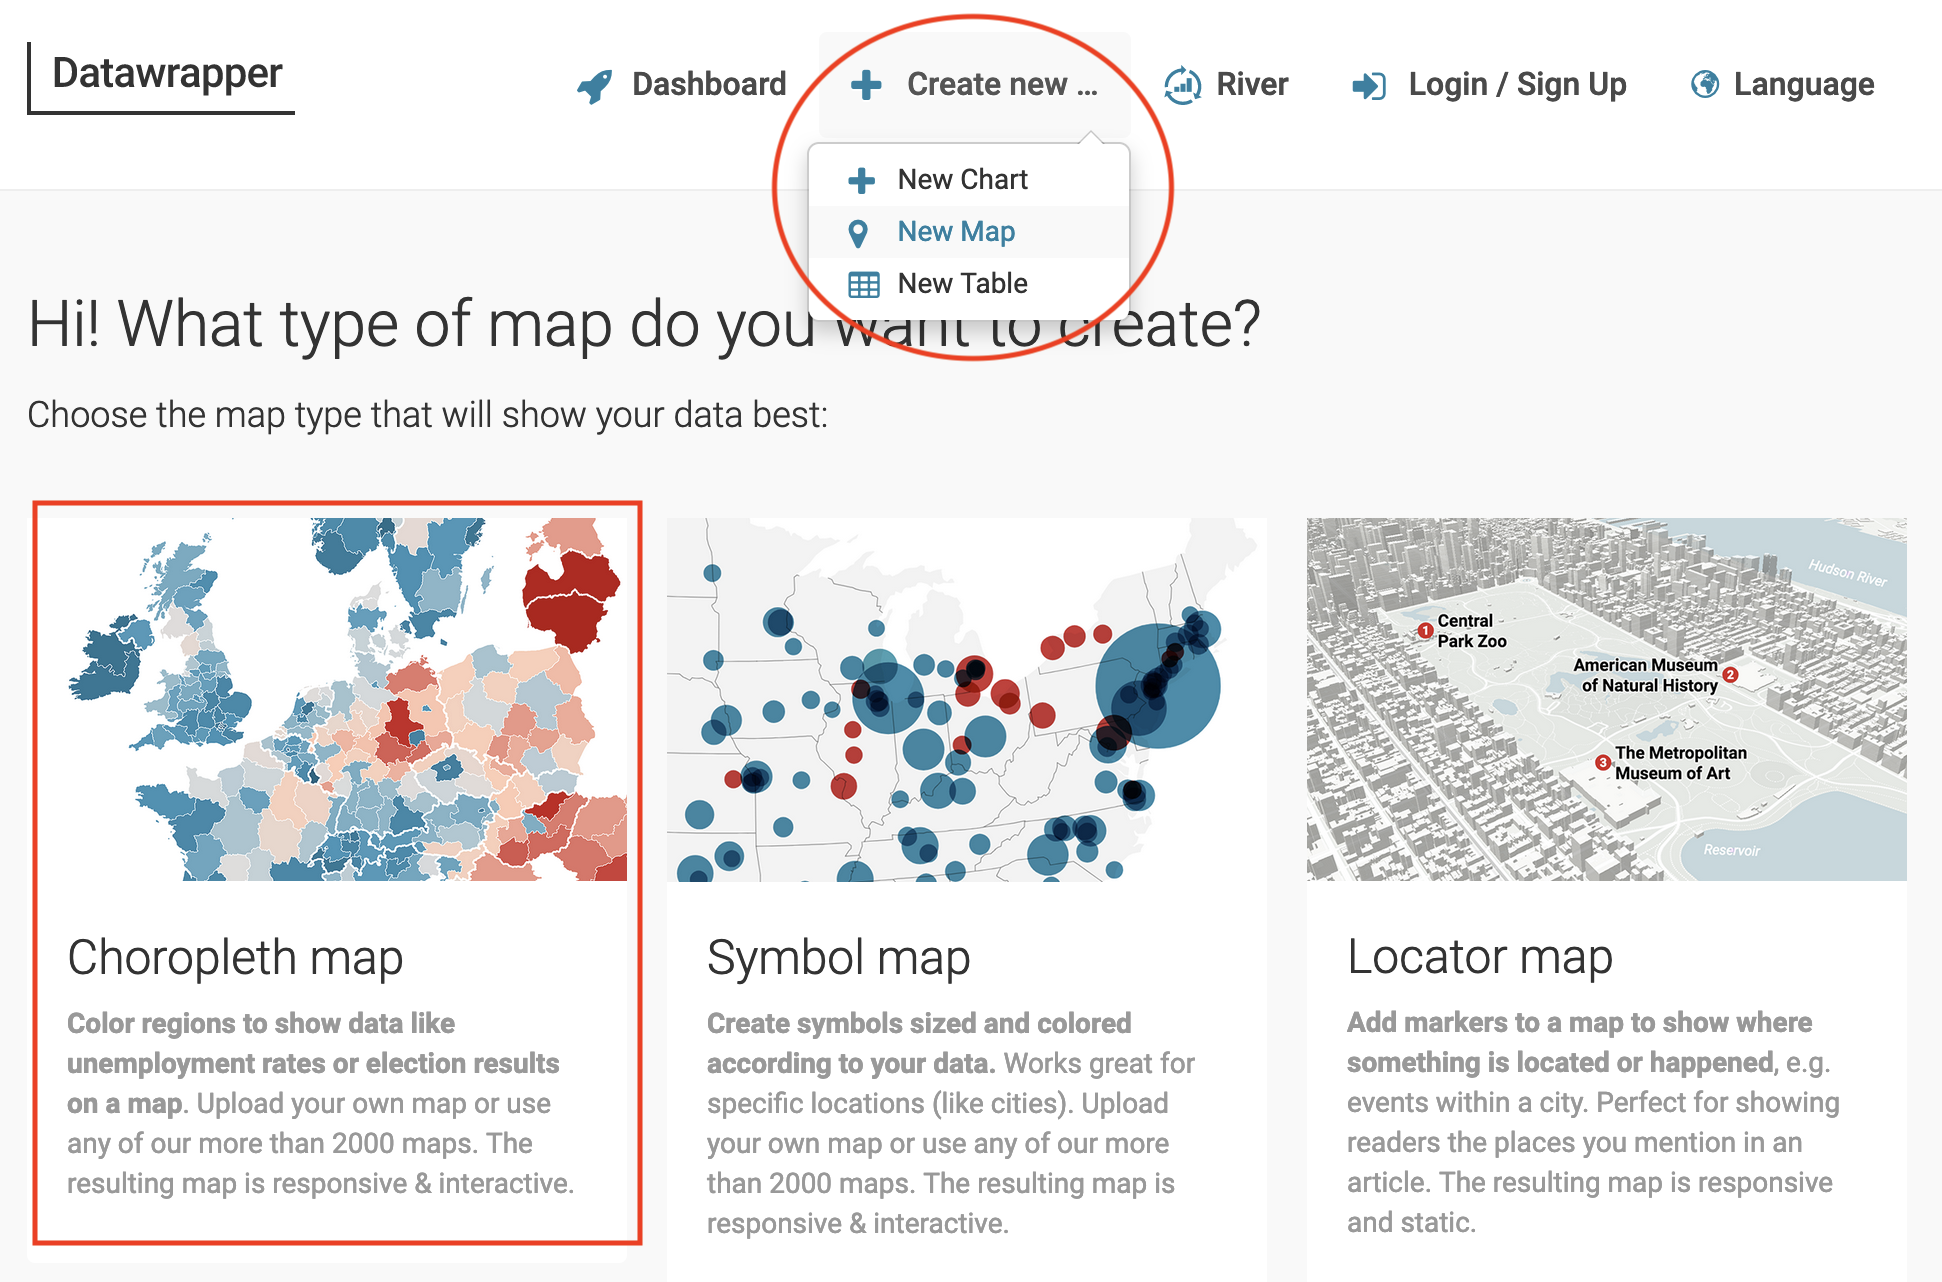
Figure 7.48: In Datawrapper, click Create new…- New Map, and choose Choropleth.
- In the Select your map screen, choose your geographic boundaries. In this case, search and select USA > States, as shown in Figure 7.49, then click Proceed.
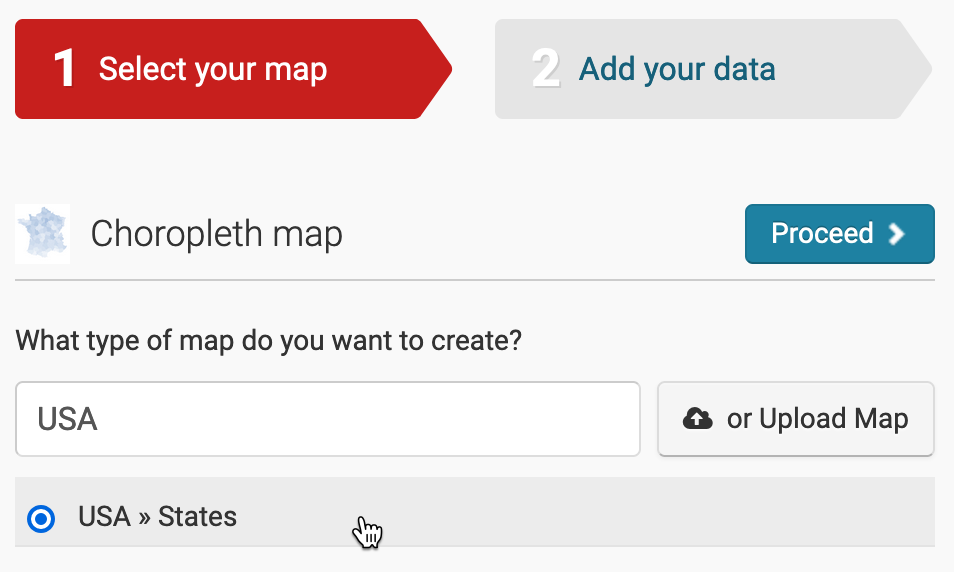
Figure 7.49: Choose USA - States for your map outline.
Tip: Note that Datawrapper includes geography for Washington DC in USA - States, even though the District of Columbia is not officially recognized as a state. If you have data that you wish to display for other US territories, choose USA - States & Territories, which includes geography for Puerto Rico, US Virgin Islands, Guam, Northern Mariana Islands, and American Samoa.
Tip: If Datawrapper does not list your preferred map outline, you can upload your own custom geography data in GeoJSON or TopoJSON format, which you will learn more about in the GeoJSON data section of Chapter 13.
- In the Add your data screen, you can manually enter data for each area, which would be fine for just a few, but not for 50 states. Instead, scroll down to the Upload tab to see other options to import data. Since your sample data for this exercise is in a Google Sheet, scroll further down and click the Connect Google Sheet button, and paste the link to your shared Google Sheet, then press Connect, as shown in Figure 7.50.
Hint: When you select a Datawrapper map, look for labels that match your data, including place names, or Federal Information Processing Standards (FIPS) codes for states or smaller census geographies, or American National Standards Institute (ANSI) alphabetical or numeric codes. Learn more from the US Census Bureau about ANSI and FIPS codes. Codes vary by the type of map. For example, a world map may accept country names (which vary in spelling) or ISO three-letter codes. If necessary, you could copy and paste names and their code equivalents into your spreadsheet to prepare your data. Learn more about place name geocoding at the Datawrapper Academy.
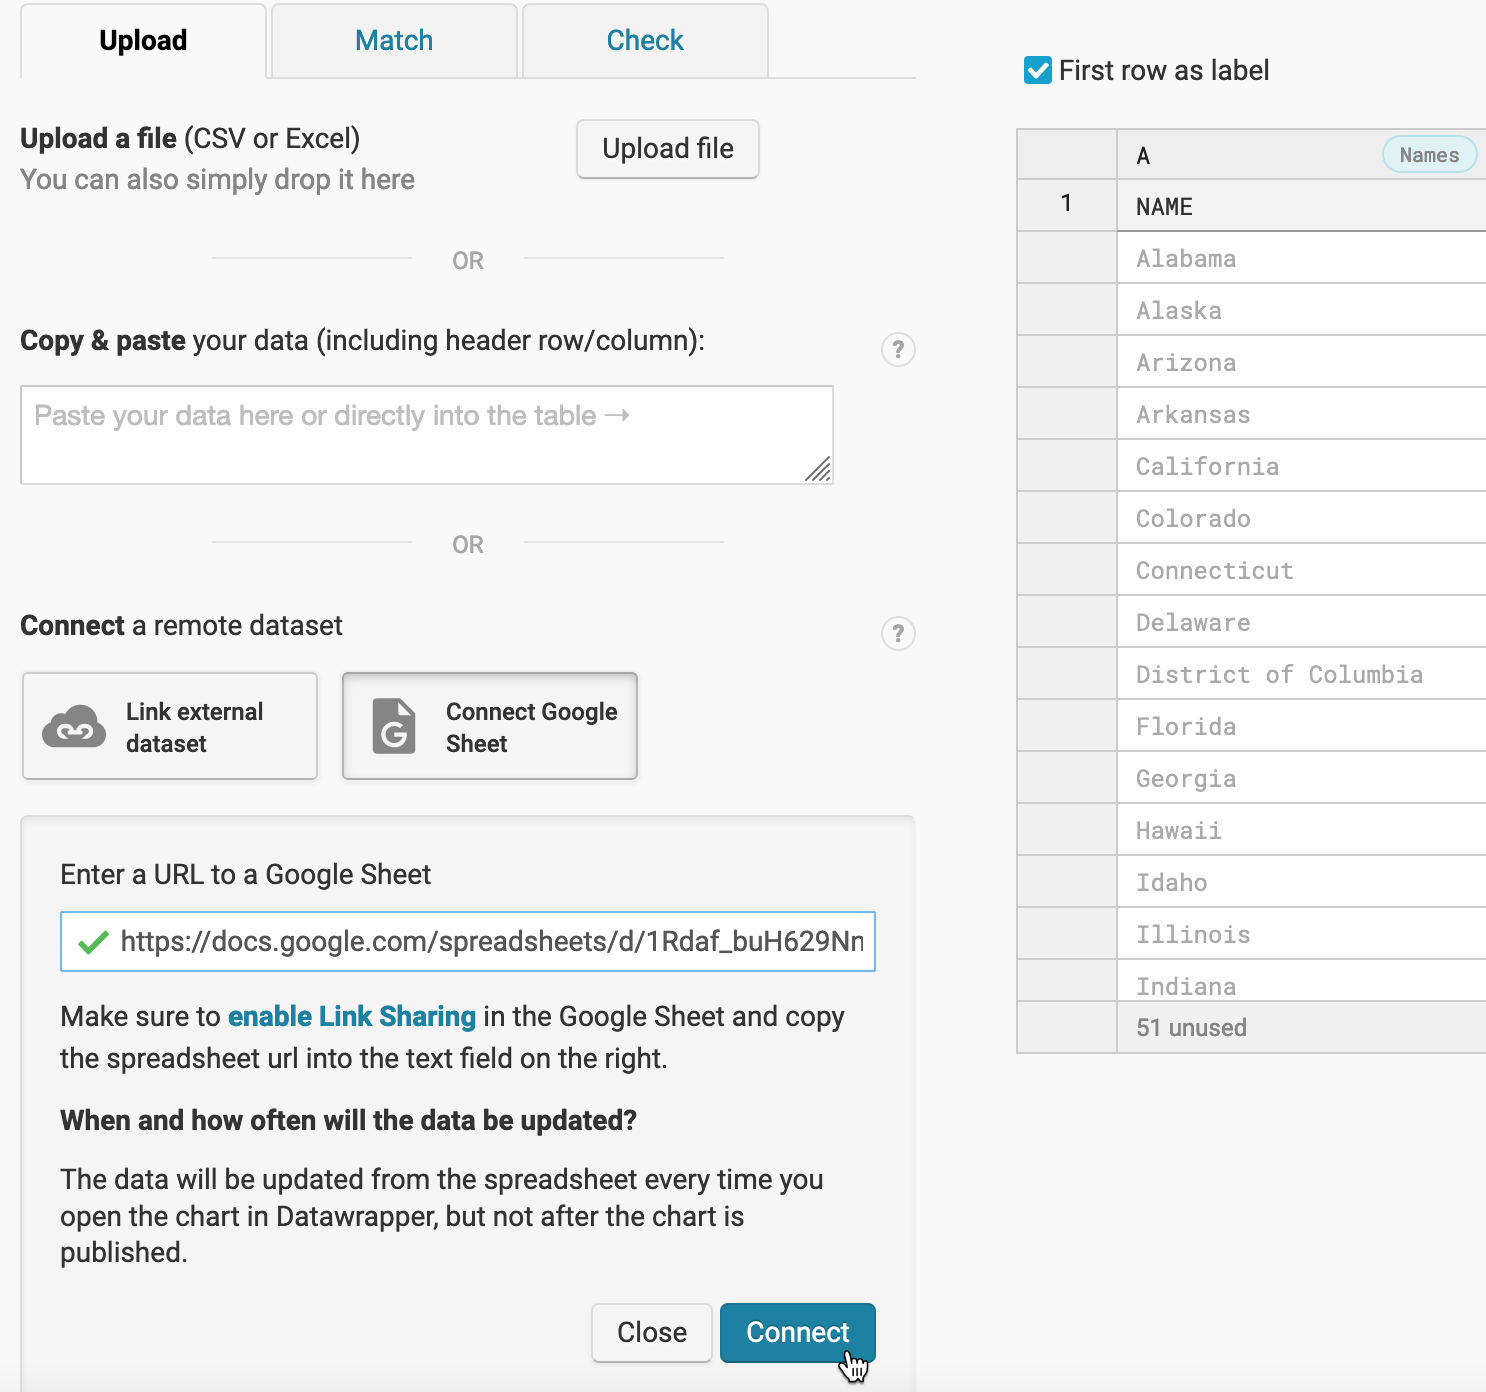
Figure 7.50: In the Upload tab, scroll down to click Connect Google Sheet and paste the link to import your data.
- Carefully inspect your data upload. Datawrapper will display a sample map and table to review how it attempted to match each row to a geographic area. In the table, Datawrapper shows numbers in blue, dates in green, and text data in black, while red represents errors or missing data. If necessary, click the Match or Check tabs to inspect your data or address errors. If you approve the data upload, click Proceed or advance to the Visualize tab, as shown in Figure 7.51.
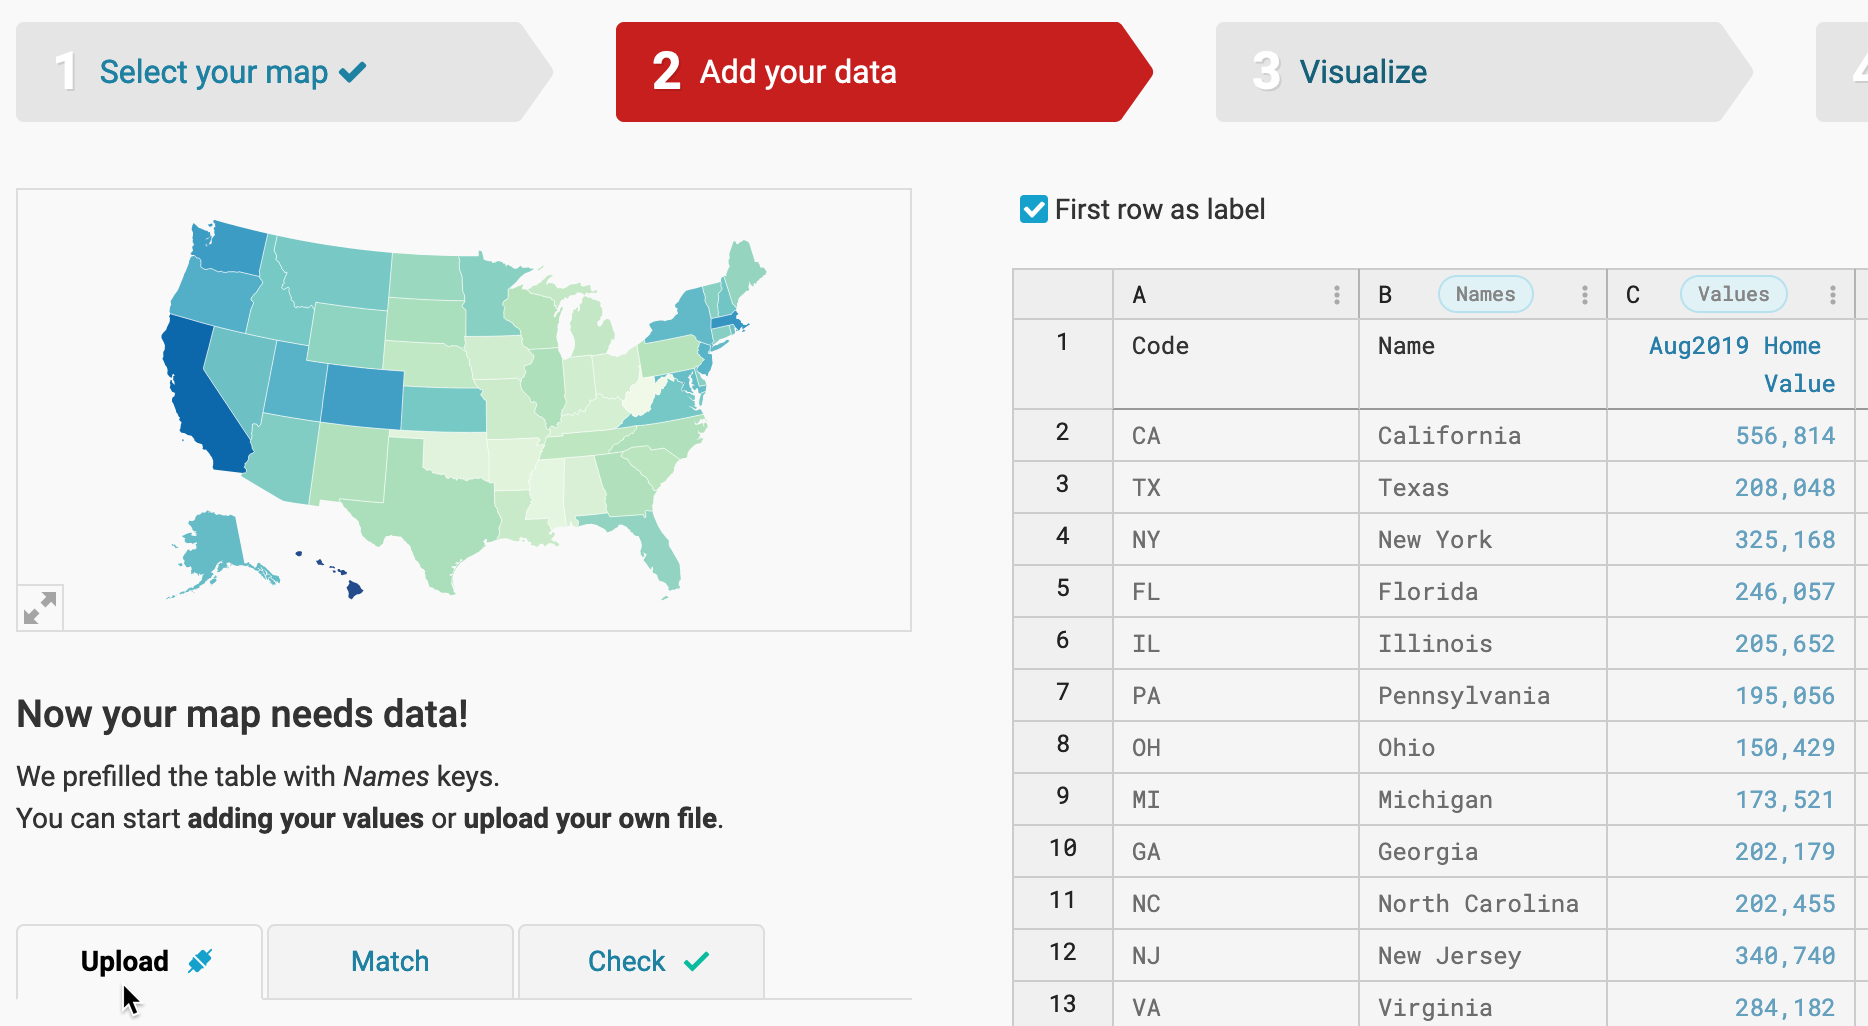
Figure 7.51: Inspect your data upload before you proceed to the next step.
- In the Visualize screen, under the Refine tab, select the column named Aug2020 Home Values to create the initial map, as shown in Figure 7.52.
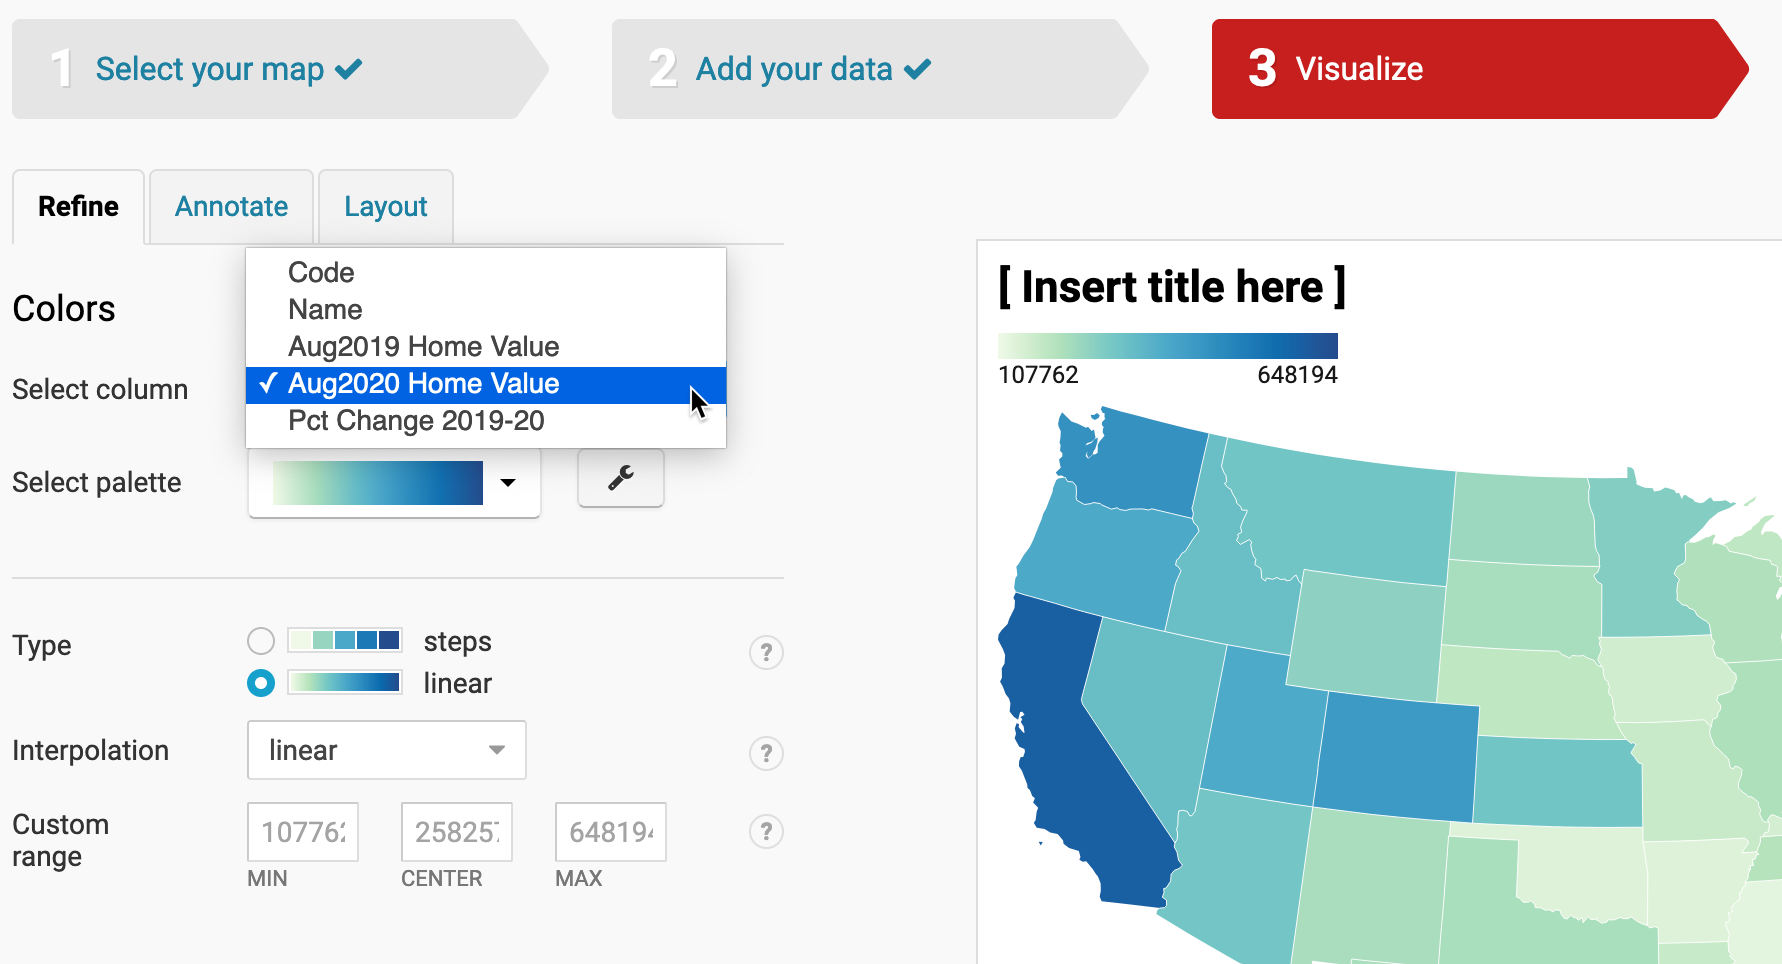
Figure 7.52: Under the Refine tab, click the column named Aug2020 Homes Values.
Do not blindly accept the default map, but it’s a good place to start and explore how factors shape its appearance. Let’s review key concepts we first introduced in the Design Choropleth Colors & Intervals section of this chapter. The default map shows a sequential green-to-blue color palette, using a continuous gradient ramp, with linear interpolation, which means the home values are distributed in a straight line up the scale. These colors and intervals work better for a data story that emphasizes the low and high extremes.
In the Refine tab, experiment with how changing settings affects the appearance of your map and the story it emphasizes about your data. For example, change Type from a continuous color gradient (like a ramp) to steps (like a staircase), which makes intervals (or ranges) sharper and more distinct in your data, as shown in Figure 7.53. This map works better for a data story that emphasizes groups at the high or low extremes, or above or below specific thresholds.
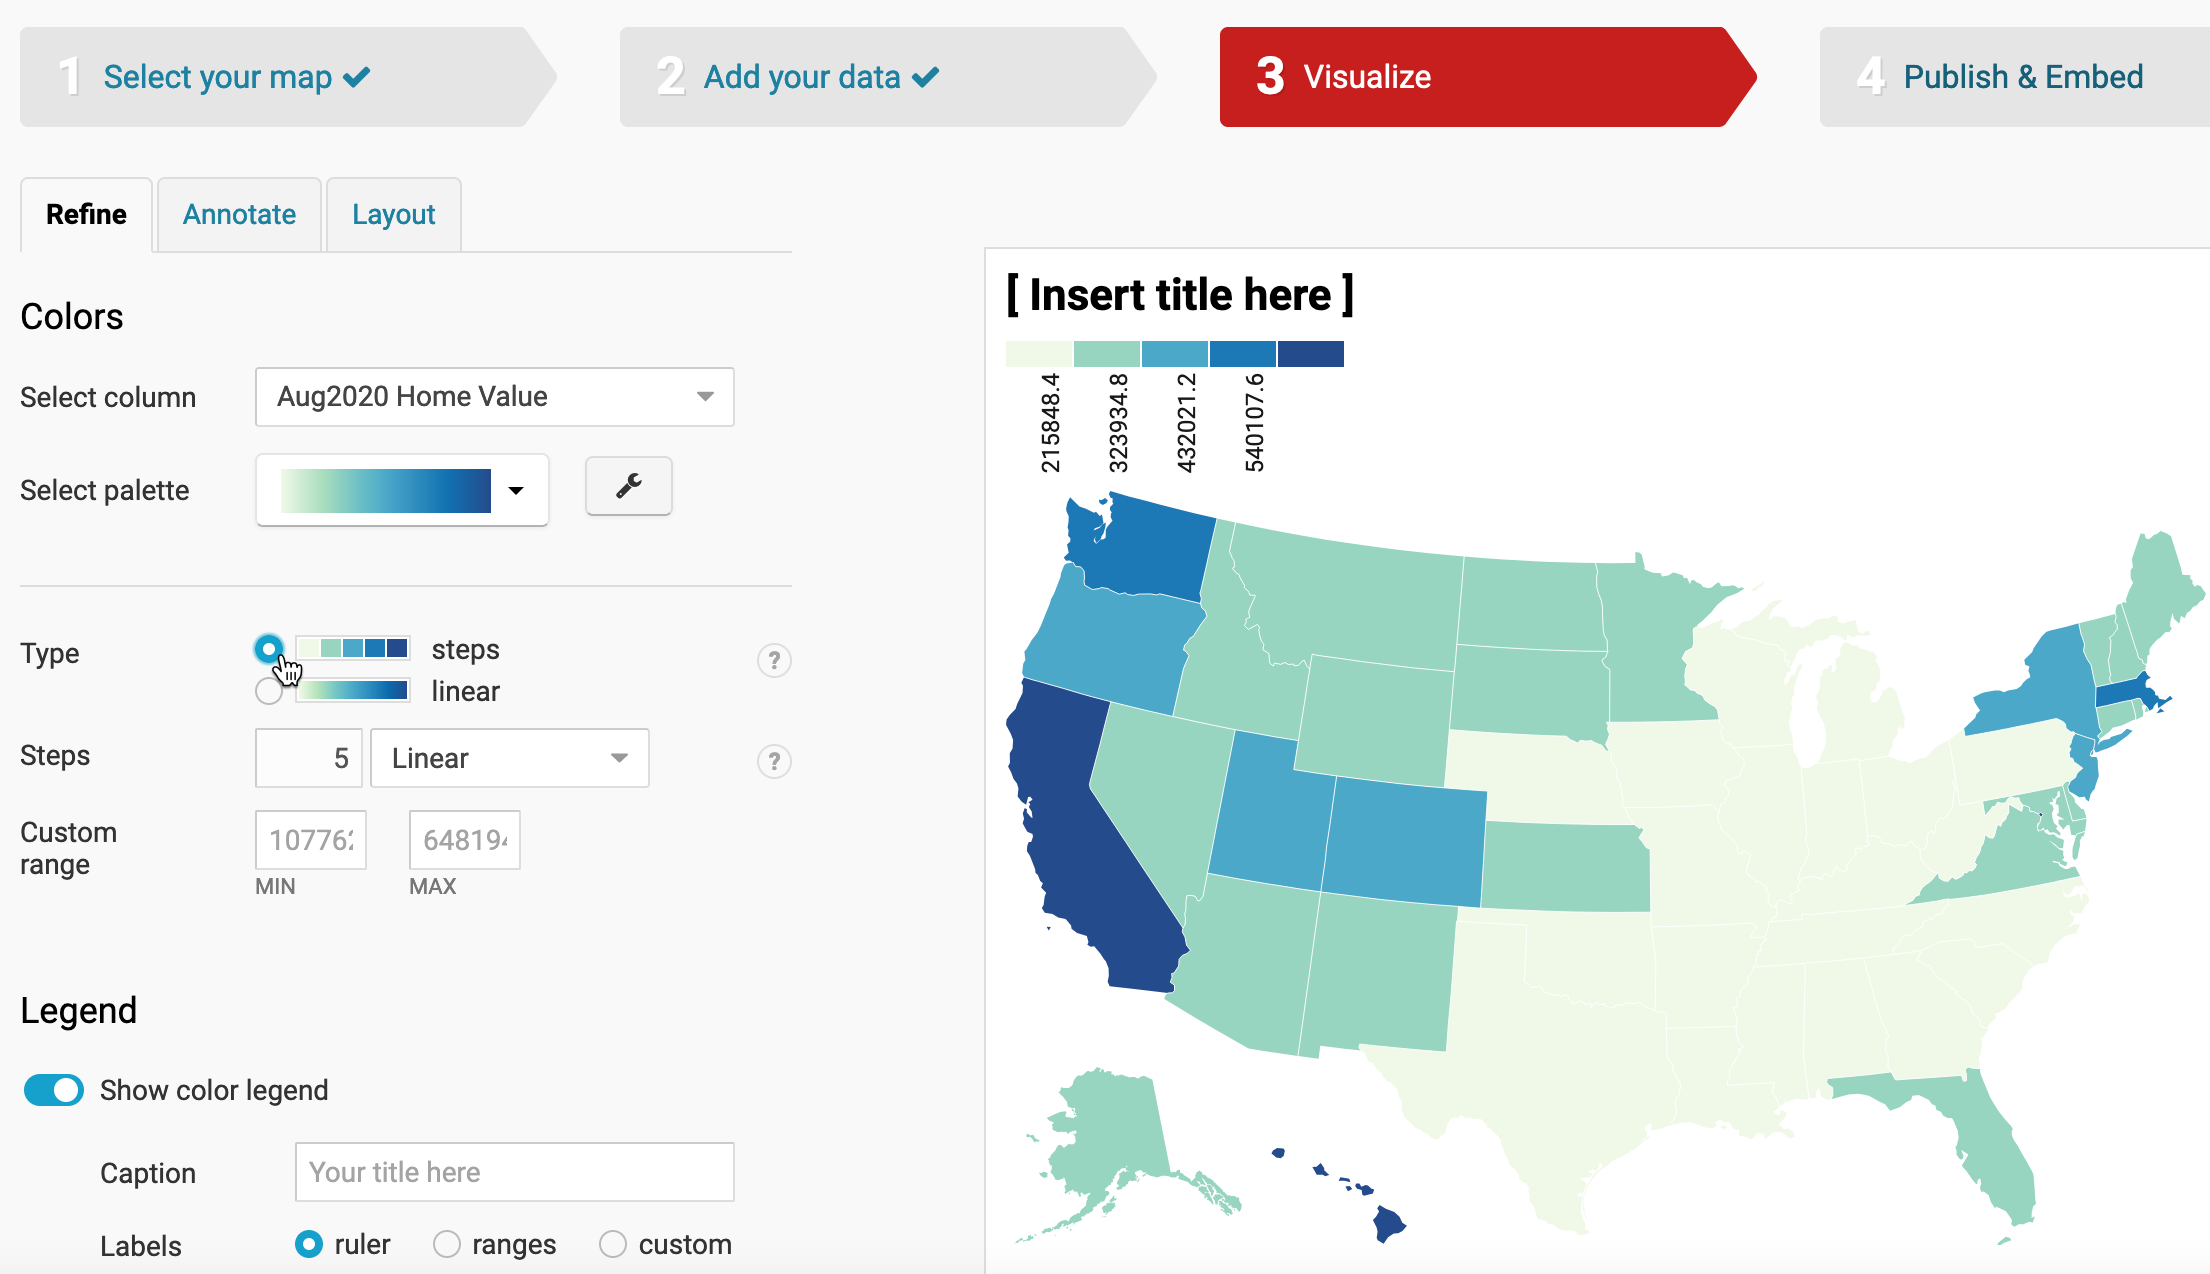
Figure 7.53: Under the Refine tab, experiment with changing Type to steps.
- Now, switch Type from steps back to the continuous color gradient, and let’s experiment with different types of Interpolation. Interpolation in this context is a function of assigning values to colors, and Datawrapper’s default is set to linear. Let’s switch it to quartiles, which bundles values into four groups of equal size, as shown in Figure 7.54. This map works better for a data story that emphasizes geographic diversity, since we see more contrast between states in the middle range, rather than highlighting only the extremes.
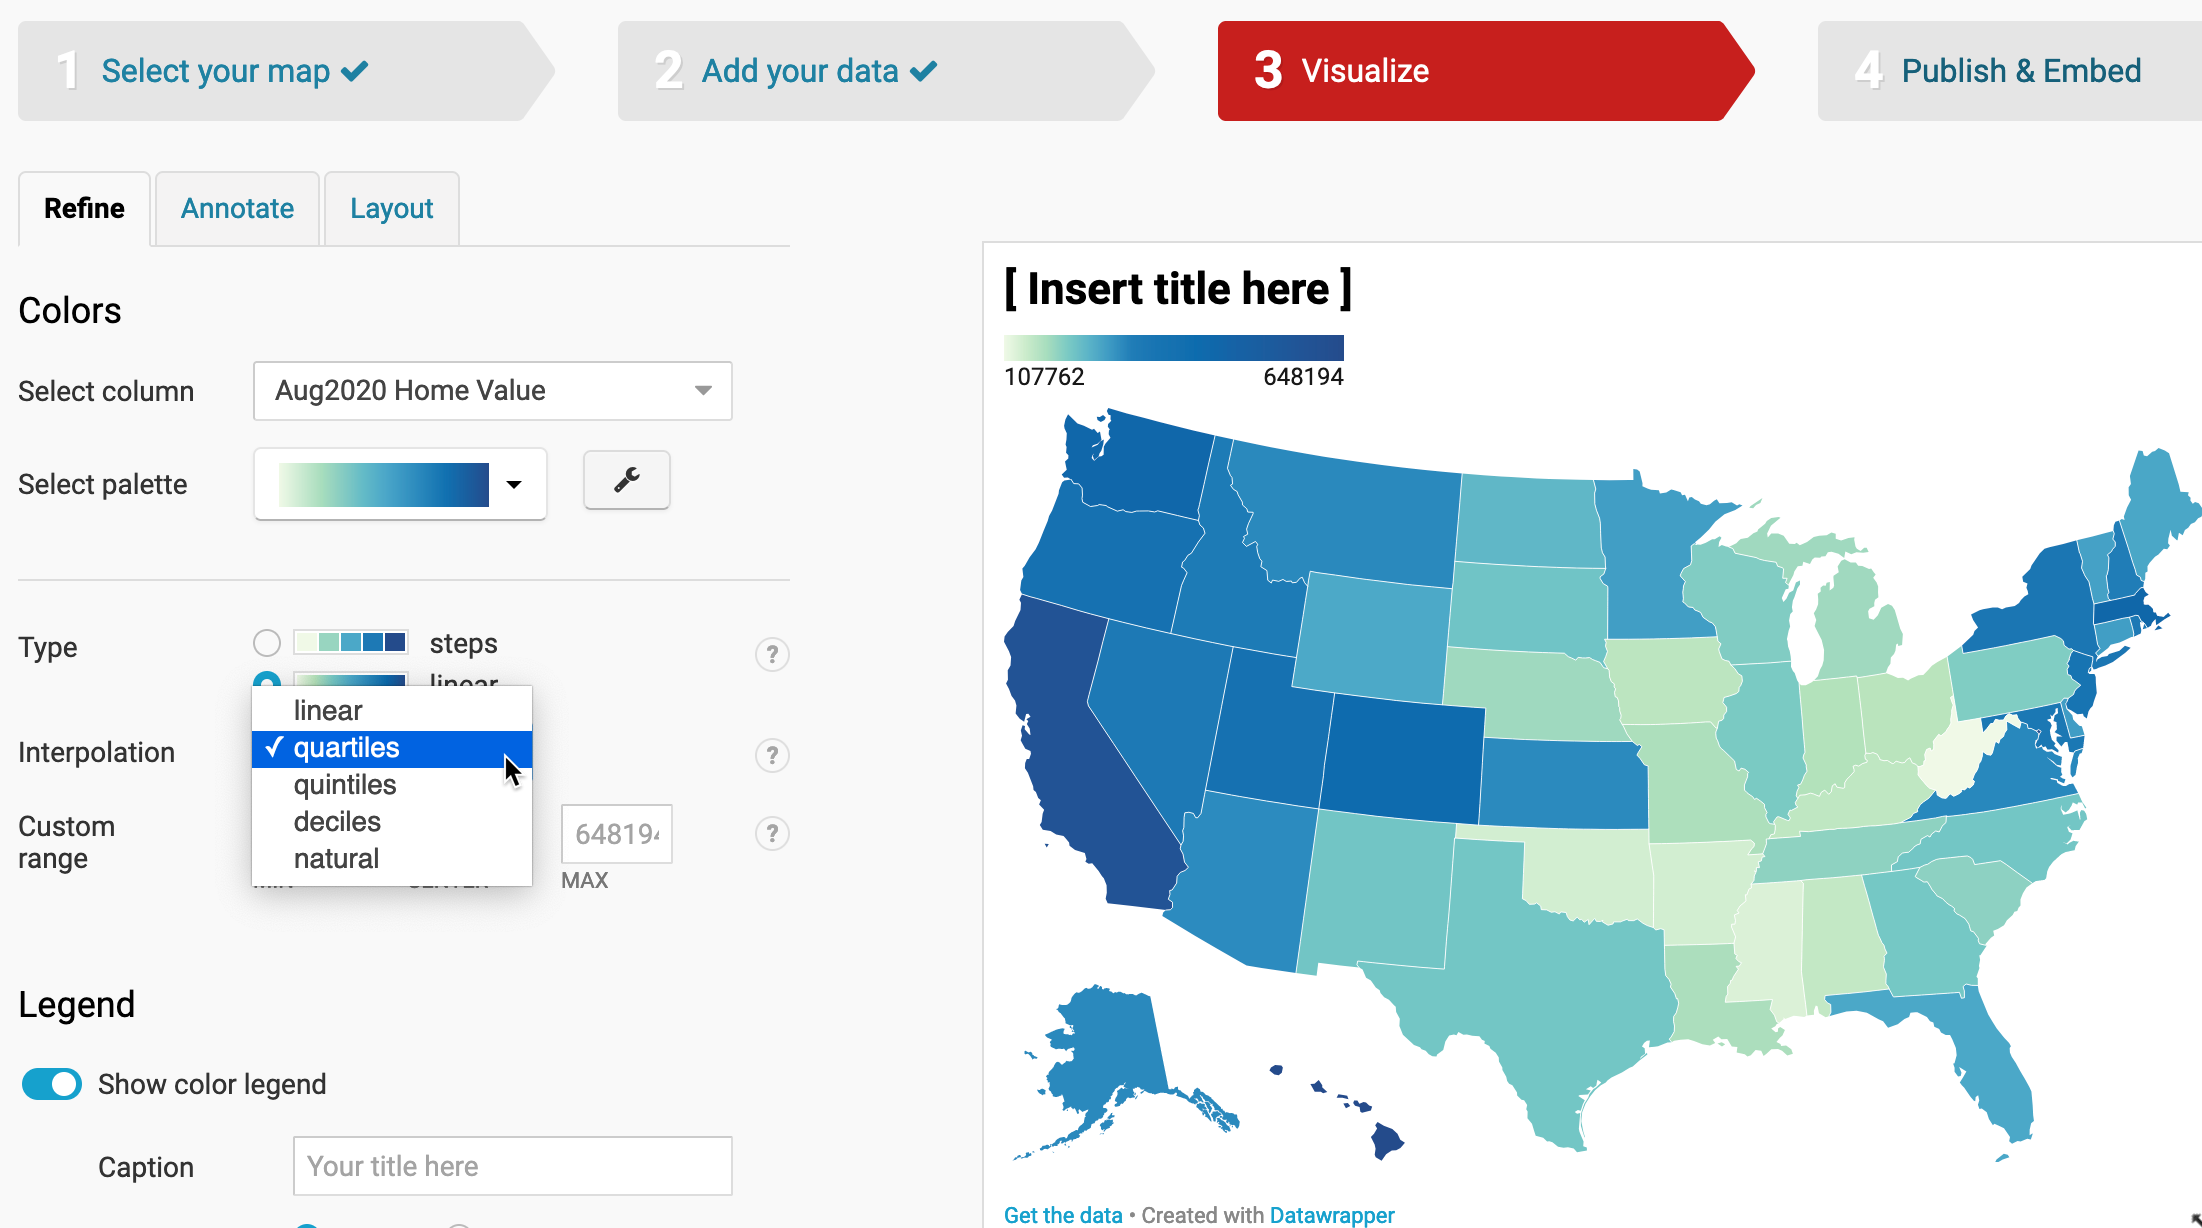
Figure 7.54: Under the Refine tab, change the interpolation from linear to quartiles and see how the map changes.
- Experiment with other colors, intervals, and data columns. Change the palette from sequential to diverging colors, which display a neutral color in the middle range and two dark colors at the extremes. Diverging palettes are often used to represent change in values, and Pct Change 2019-20 column would be a good candidate. Figure 7.55 shows our map of percent change in home values from 2019 to 2020, with a diverging red-to-blue palette of 5 steps. Two shades of red were assigned to represent decreases in values, but in fact the only state with a negative home value change is Alaska (-6.66%). You can notice that Alaska is painted in the darkest red (assigned to all values lower than -5%), and the lighter red is not used at all. This is to keep bucket sizes of equal size of 5 percentage points each.
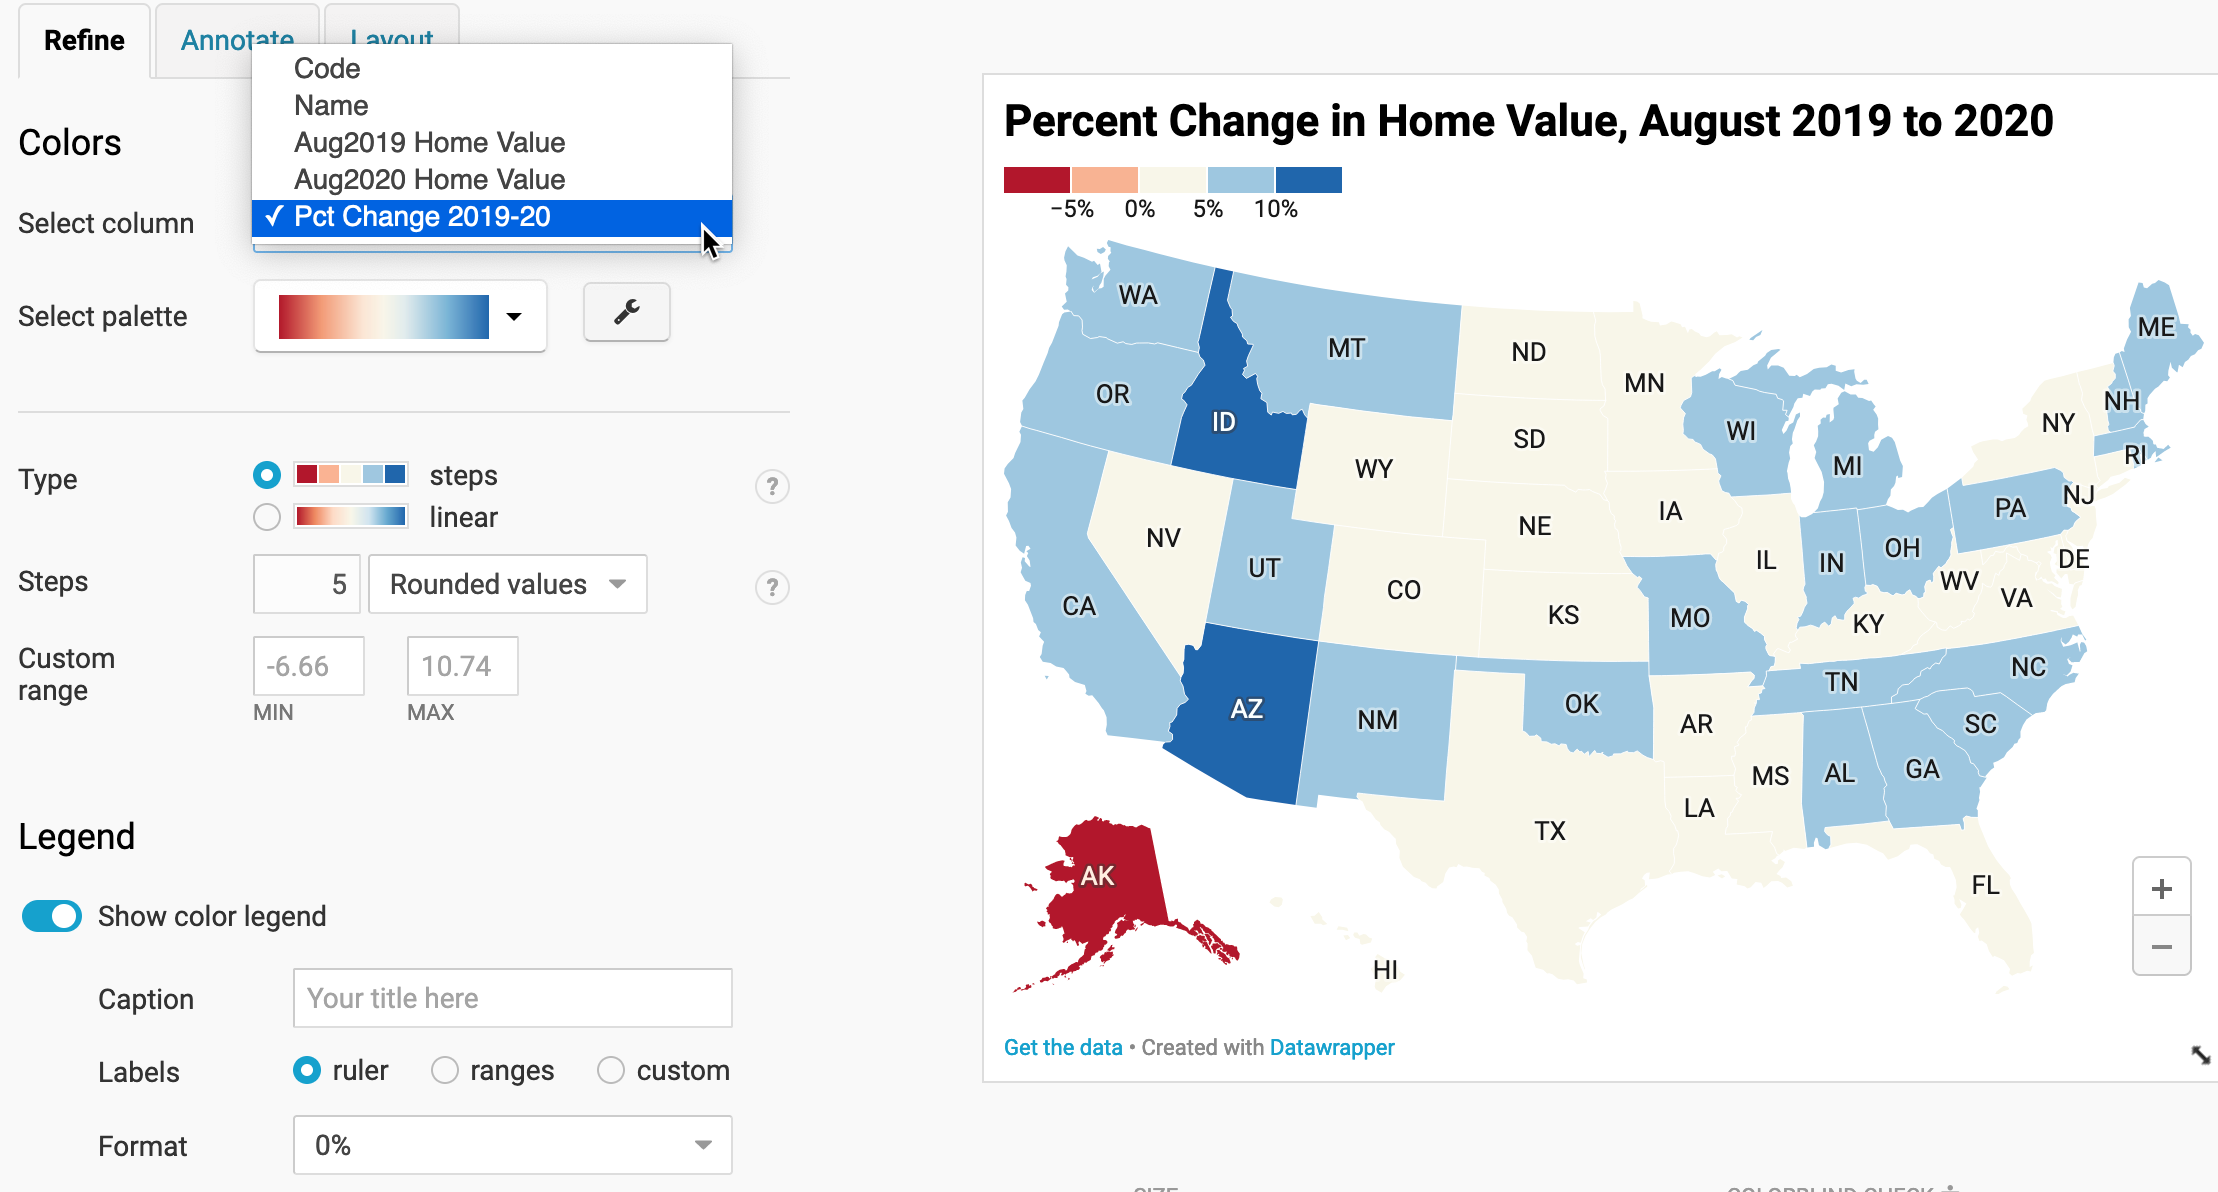
Figure 7.55: Experiment with other colors, intervals, and data columns to find true and meaningful stories.
Which data columns, colors, and intervals make the best map? There’s no easy answer, since there’s more than one way to make a true and meaningful map. But keep two principles in mind. First, make sure that you honestly show the data, rather than hide or disguise it. Second, reflect on what kind of data story you believe is important to tell, since design choices emphasize different interpretations of the data. Review our guidance in the Design Choropleth Colors & Intervals section.
Let’s move on to finalize the labels and styling of the map before we publish and share it with others.
- Under the Refine tab, customize the legend format. For example, to convert long numbers (such as 107762) into abbreviated dollars ($ 108 k), we selected custom format and inserted the code
($ 0 a), as shown in Figure 7.56. Learn more about Datawrapper custom formats in their link to the numeral.js documentation.
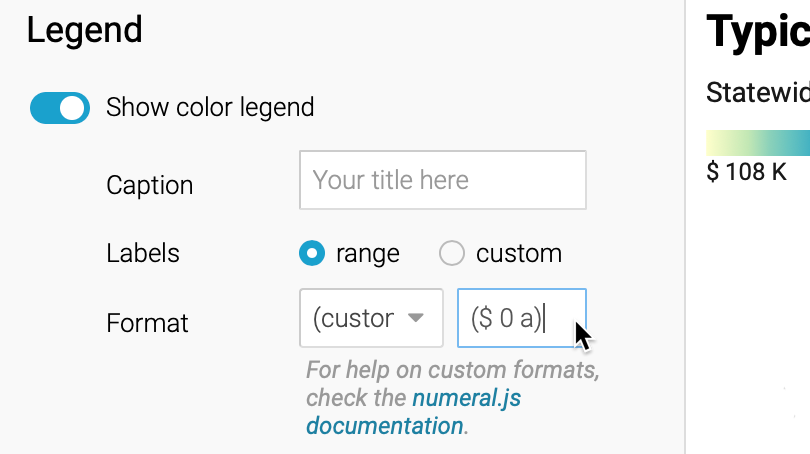
Figure 7.56: Change how numbers appear in the legend by entering a custom format.
- Under the Annotate tab, add a title, description, and cite your sources to add credibility to your work. You can also add map labels and customize tooltips that will display when readers hover their cursor over different states. The easiest way to edit tooltips is to click on blue column names, or format them using their drop-down menus, to make the proper codes appear in double curly brackets, as shown in Figure 7.57. Learn more about customizing tooltips from Datawrapper Academy.
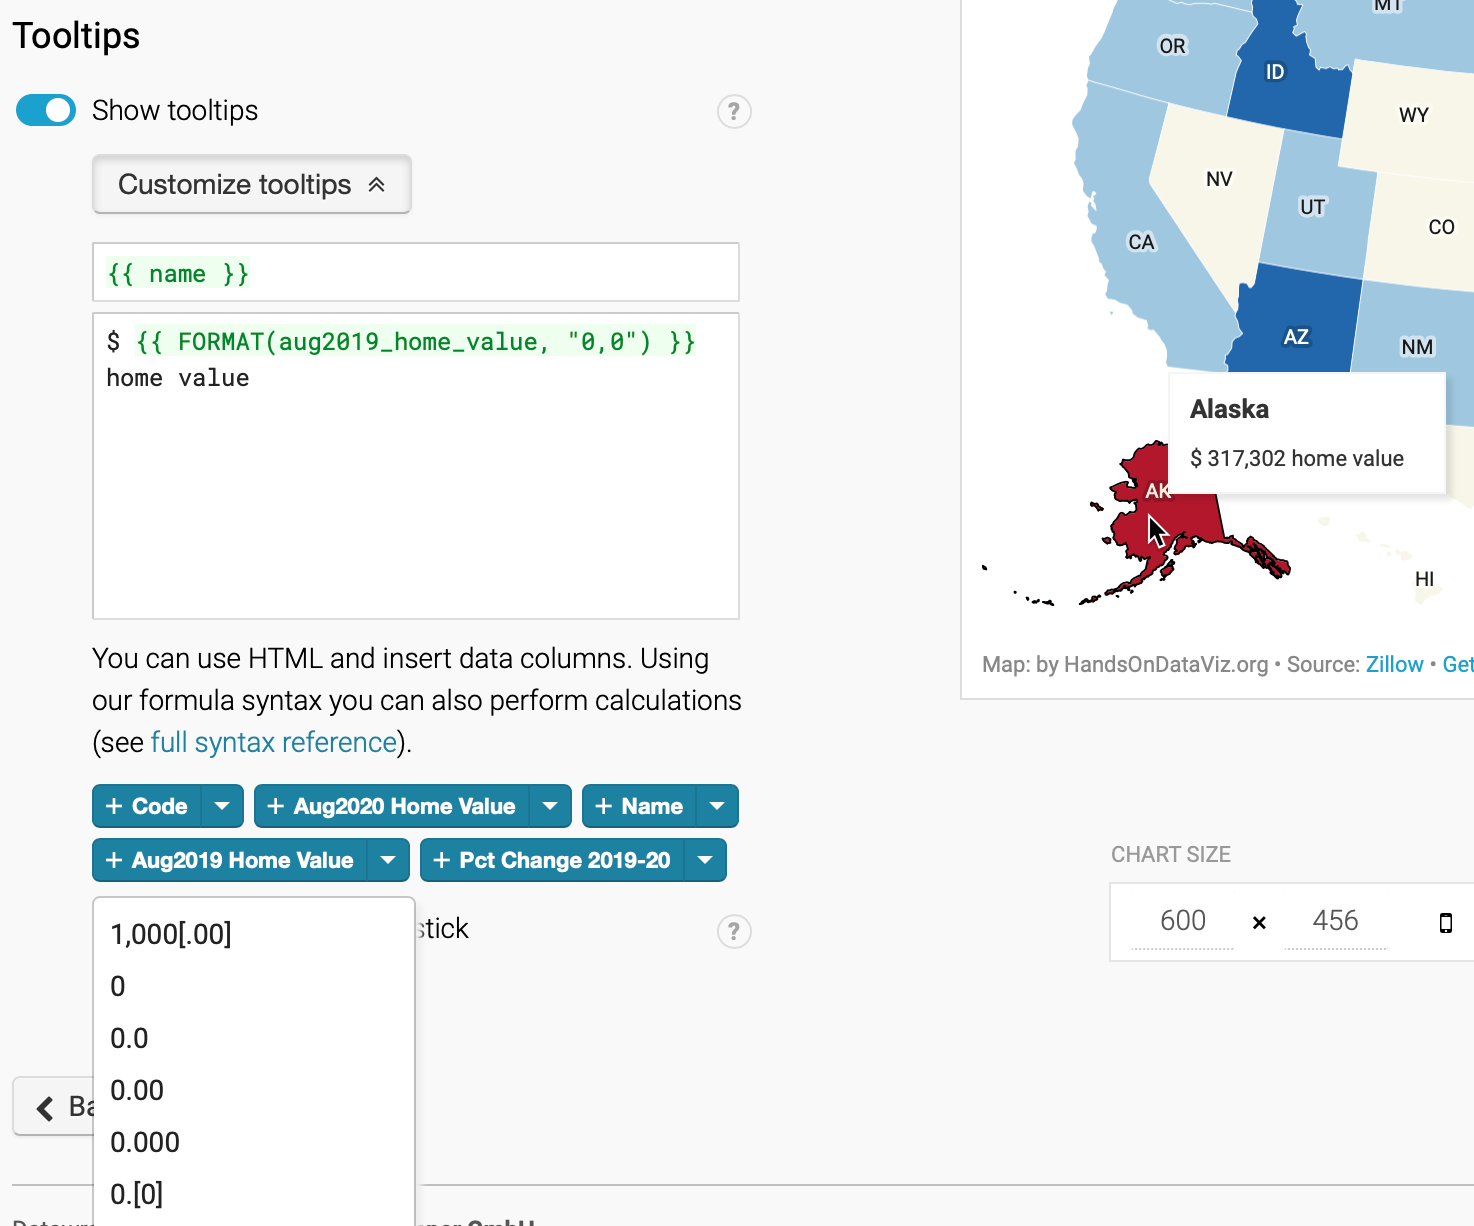
Figure 7.57: To edit tooltips, click the blue column names or use drop-down menus to format the codes.
- Finally, click Proceed or advance to the Publish & Embed screen to share your work with others. Follow the prompts, or the more detailed Datawrapper tutorial above, to obtain an embed code to your interactive map, and learn more about your next steps in Chapter 9: Embed on the Web.
Tip: Learn more about choropleth map design in this excellent series of posts by the Datawrapper Academy.
Now that you’ve learned how to create a choropleth map using one tool, Datawrapper, let’s compare the process using a different tool, Tableau Public.