#StandWithUkraine - Stop the Russian invasion
Join us and donate. Since 2022 we have contributed over $5,000 in book royalties to Save Life in Ukraine & Ukraine Humanitarian Appeal & The HALO Trust, and we will continue to give!
Chapter 9 Embed On the Web
So far you’ve learned how to create charts in chapter 6, maps in chapter 7, and tables in chapter 8. Our book emphasizes the benefits of designing interactive visualizations that engage broad audiences on the internet by inviting them to interact with your data, investigate new patterns, download files if desired, and easily share your work on social media. In this chapter, you’ll learn about a computer code tag called an iframe, which allows readers to actively explore your data on a different page. Like a picture frame, an iframe displays a live web page (such as your interactive data visualization) inside a second web page that you control (such as your personal or organizational web site), as shown in Figure 9.1. When done correctly, the iframe makes your data visualization appear seamlessly on your web page, so that audiences can explore the content without needing to know that it’s coming from a different host. Several of the visualization tools you’ve learned so far, such as Google Sheets, Datawrapper, and Tableau Public, generate an embed code that contains an iframe to the online chart or map you’ve created on their platform. We will demonstrate how to get the embed code or link from your visualization tool site, and paste the code into a second website to seamlessly display your interactive content. No coding skills are required in this introductory book, but it certainly helps to be code-curious.
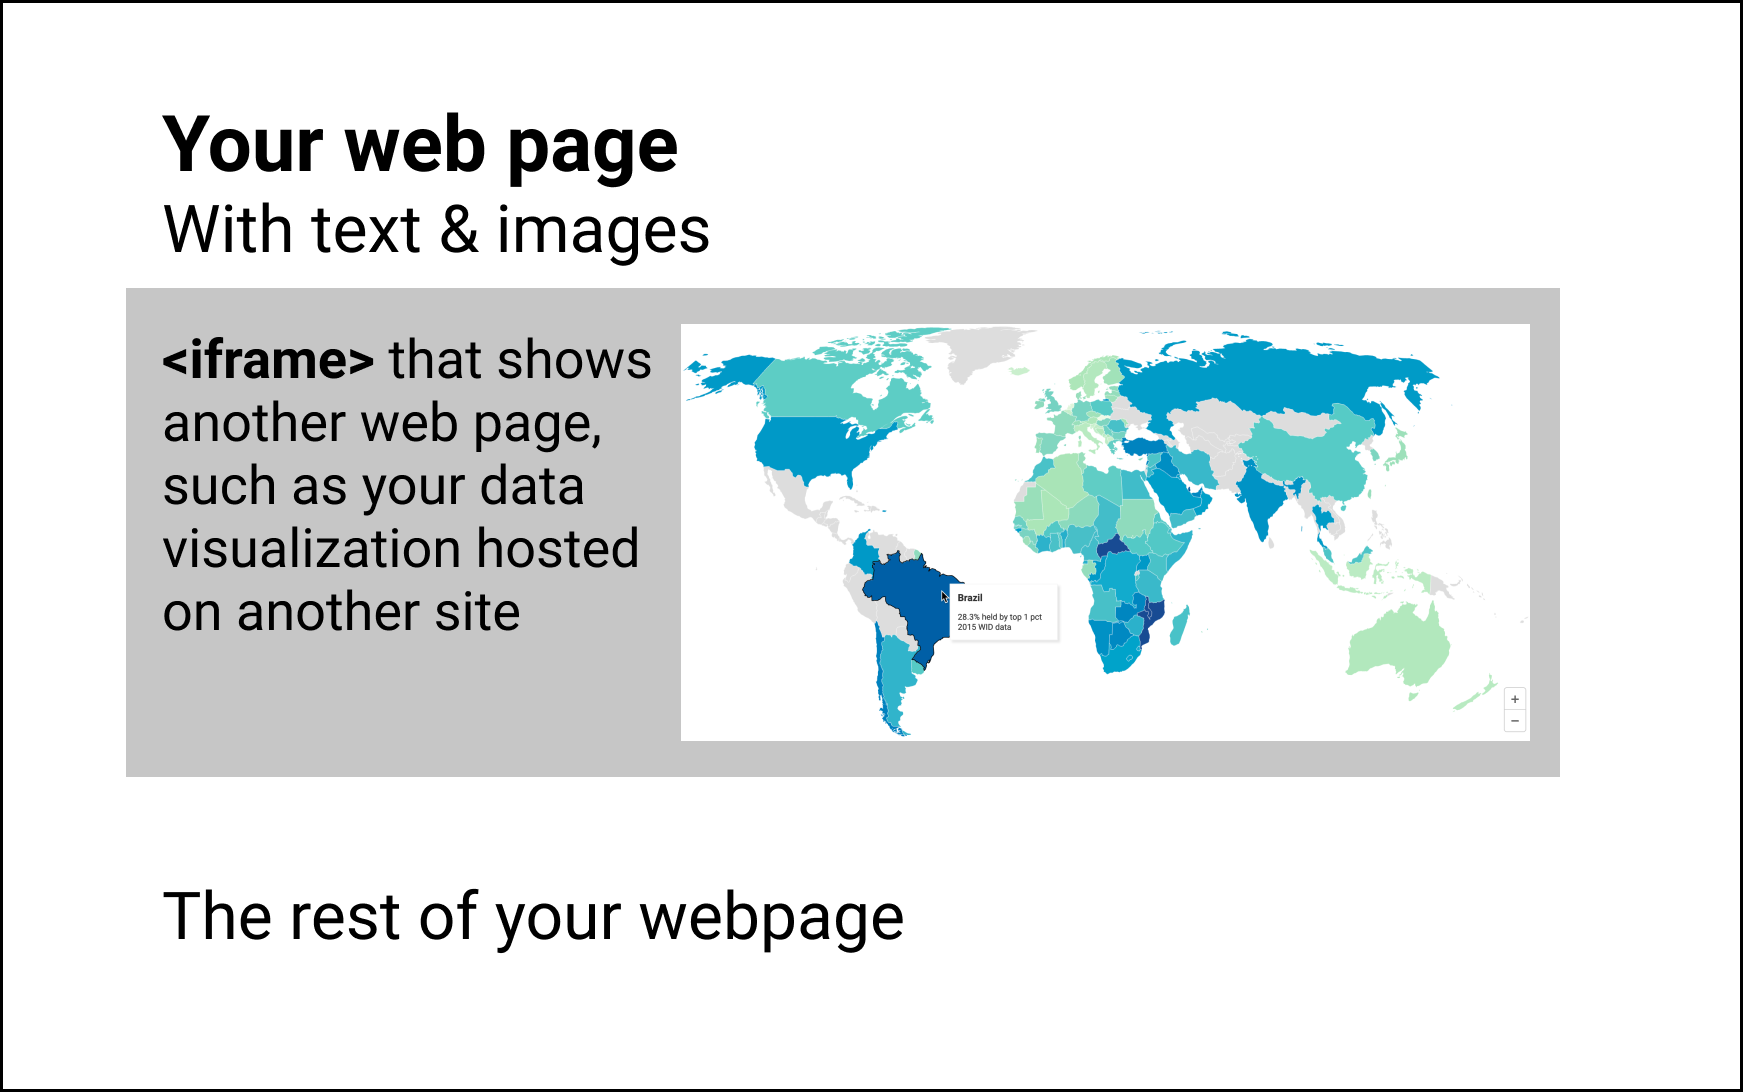
Figure 9.1: You can use an iframe to embed other web pages in your web page