#StandWithUkraine - Stop the Russian invasion
Join us and donate. Since 2022 we have contributed over $5,000 in book royalties to Save Life in Ukraine & Ukraine Humanitarian Appeal & The HALO Trust, and we will continue to give!
Clean Data with OpenRefine
Open the US Foreign Aid sample dataset in Google Sheets format as shown in Figure 4.13. Can you spot any problems with it? This data excerpt is from US Overseas Loans and Grants (Greenbook) dataset, which shows US economic and military assistance to various countries. We chose to only include assistance to South Korea and North Korea for the years between 2000 and 2018. We added deliberate misspellings and formatting issues for demonstration purposes, but we did not alter values.
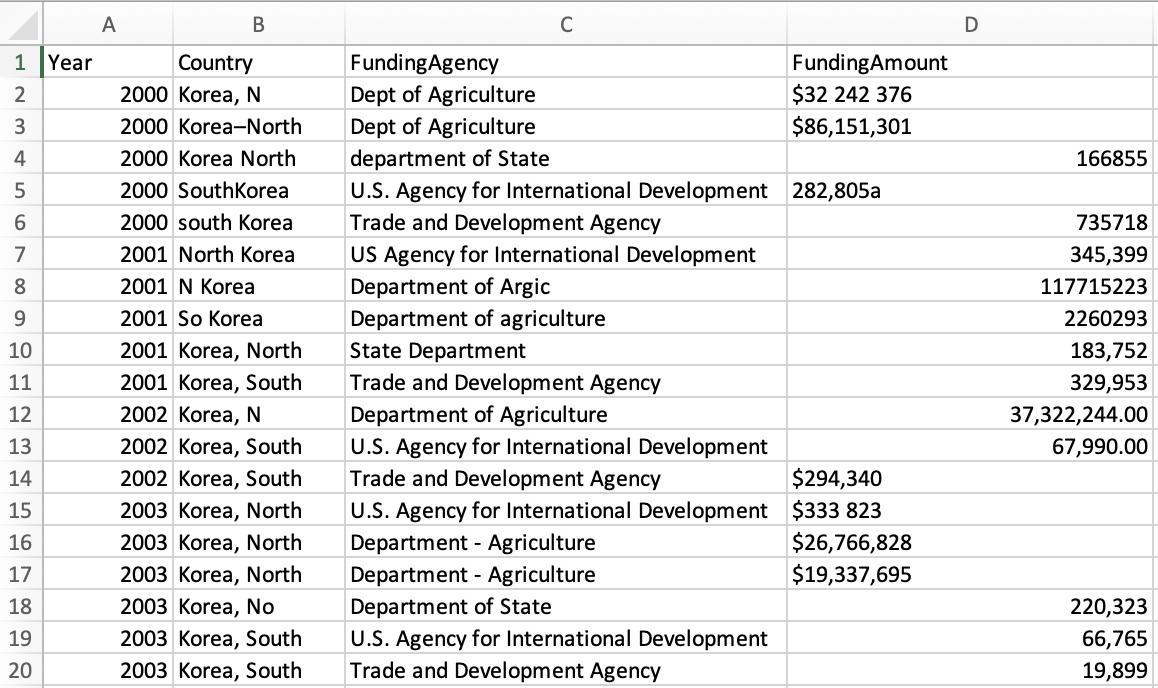
Figure 4.13: Can you spot any problems with this sample data?
Notice how the Country column various spellings of North and South Korea. Also note how the FundingAmount column is not standardized. Some amounts use commas to separate thousands, while some uses spaces. Some amounts start with a dollar sign, and some do not. Datasets like this can be an absolute nightmare to analyze. Luckily, OpenRefine provides powerful tools to clean up and standardize data.
Set up OpenRefine
Let’s use OpenRefine to clean up this messy data. Download OpenRefine for Windows, Mac, or Linux. Just like Tabula, it runs in your browser and no data leaves your local machine, which is great for confidentiality.
To launch OpenRefine in Windows, unzip the downloaded file, double-click the .exe file, and the tool should open in your default browser.
To launch OpenRefine on a Mac, double-click the downloaded .dmg file to install it. You will likely see a security warning that prevents OpenRefine from automatically launching because Apple does not recognize the developer for this open-source project. To resolve the problem, go to System Preferences > Security and Privacy > General tab, and click the Open Anyway button in the lower half of the window, as shown in Figure 4.14. If prompted with another window, click Open.
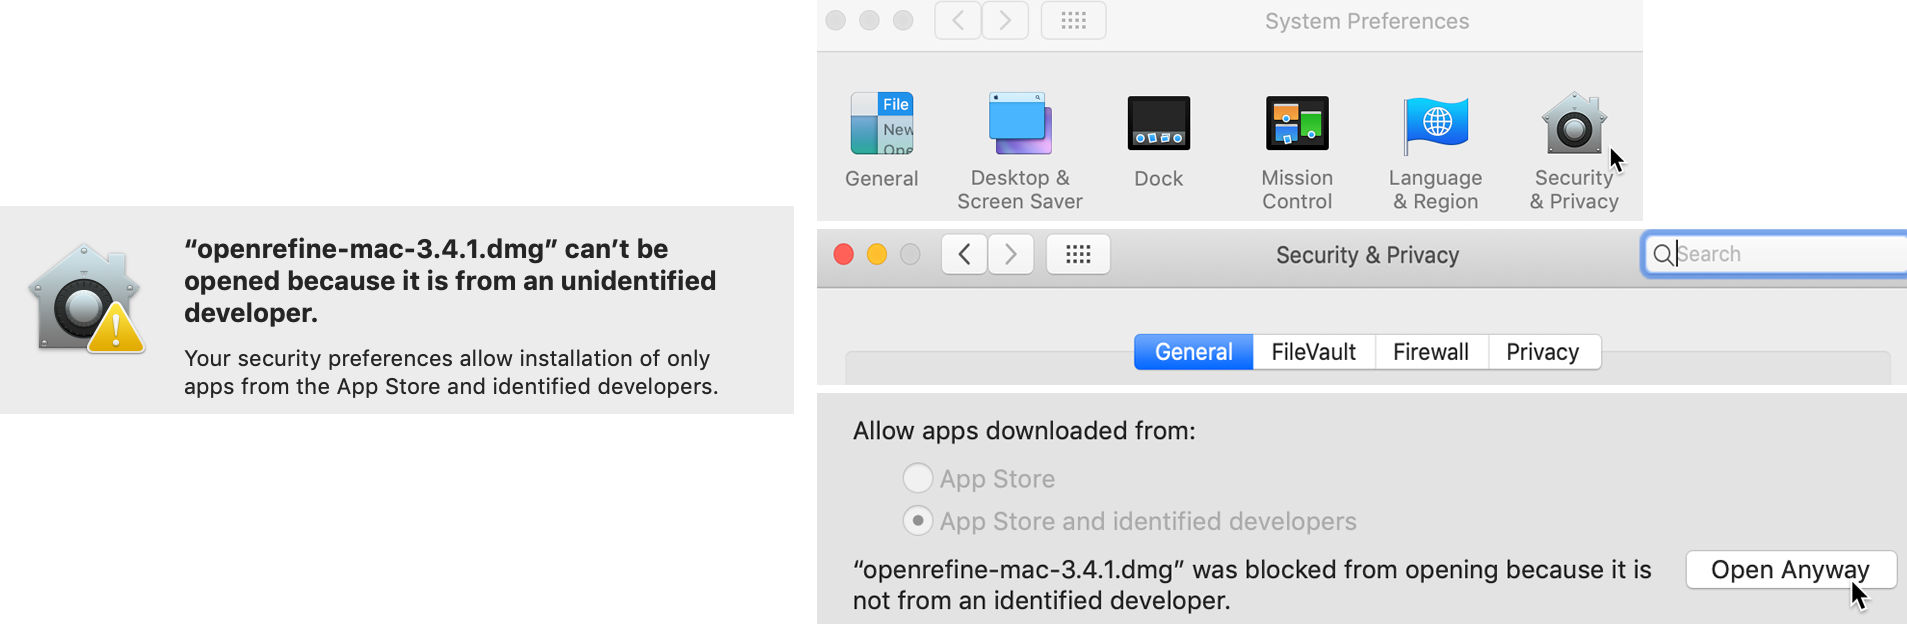
Figure 4.14: If your Mac displays a warning about launching OpenRefine (on left), go to System Preferences - Security and Privacy - General tab and click Open Anyways (on right).
When you start up OpenRefine, it will open your default browser with the localhost 127.0.0.1 address, with or without the additional port number :3333, as shown in Figure 4.15. If your regular browser (such as Safari) does not behave nicely with OpenRefine, copy and paste the localhost address into a different browser (such as Firefox or Chrome).
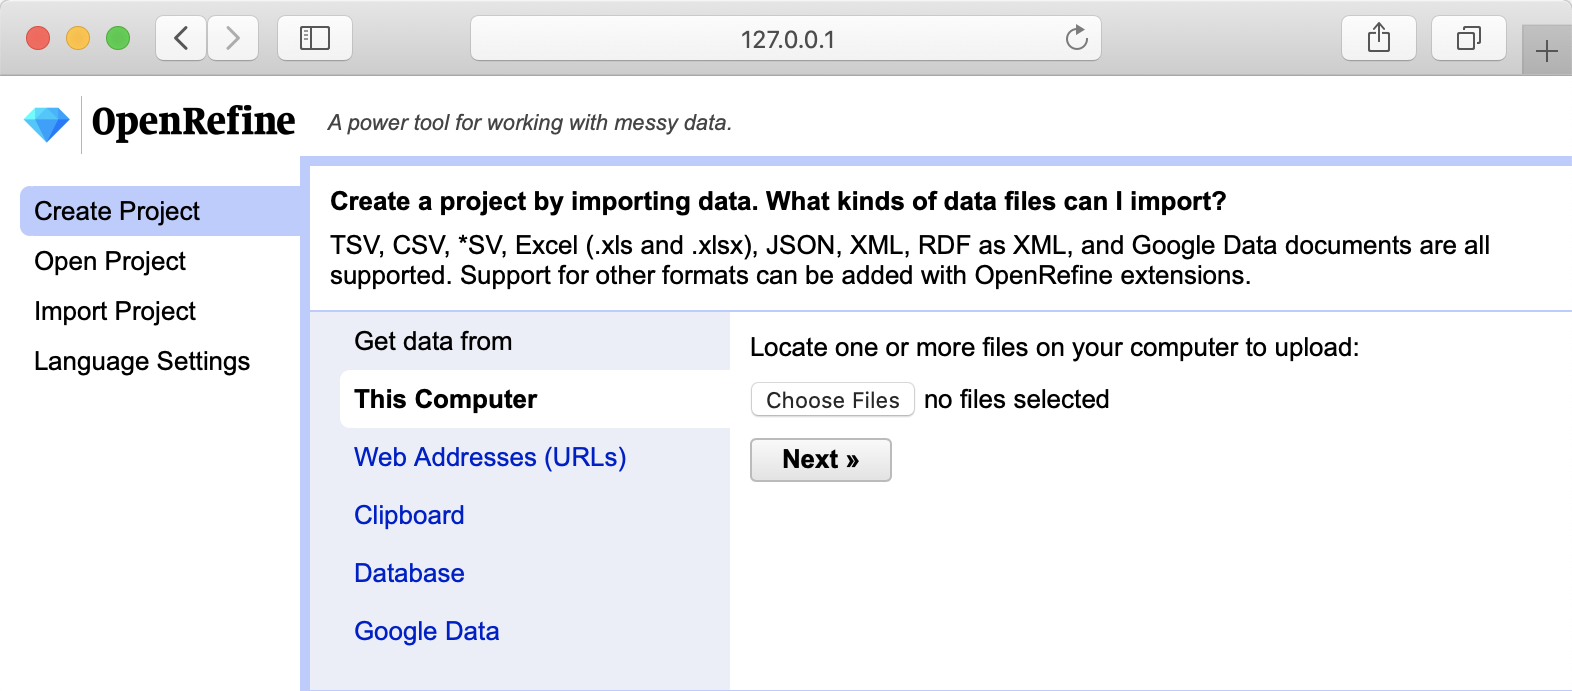
Figure 4.15: The OpenRefine welcome page.
Load Data and Start a New Project
To start cleaning up messy dataset, we need to load it into a new project. OpenRefine lets you upload a dataset from your local machine, or a remote web address (such as a Google Sheet). OpenRefine also can extract data directly from SQL databases, but this is beyond the scope of this book.
Open the US Foreign Aid sample dataset in Google Sheets, sign in with your account, and go to File > Download to save a version in comma-separated values (CSV) format to your computer.
In OpenRefine, under Get data from: This computer, click Browse… and select the CSV file you downloaded above. Click Next.
Before you can start cleaning up data, OpenRefine allows you to make sure data is parsed properly. In our case, parsing means the way the data is split into columns. Make sure OpenRefine assigned values to the right columns, or change setting in Parse data as block at the bottom of the page until it starts looking meaningful, as shown in Figure 4.16. Then press Create Project in the upper-right corner.
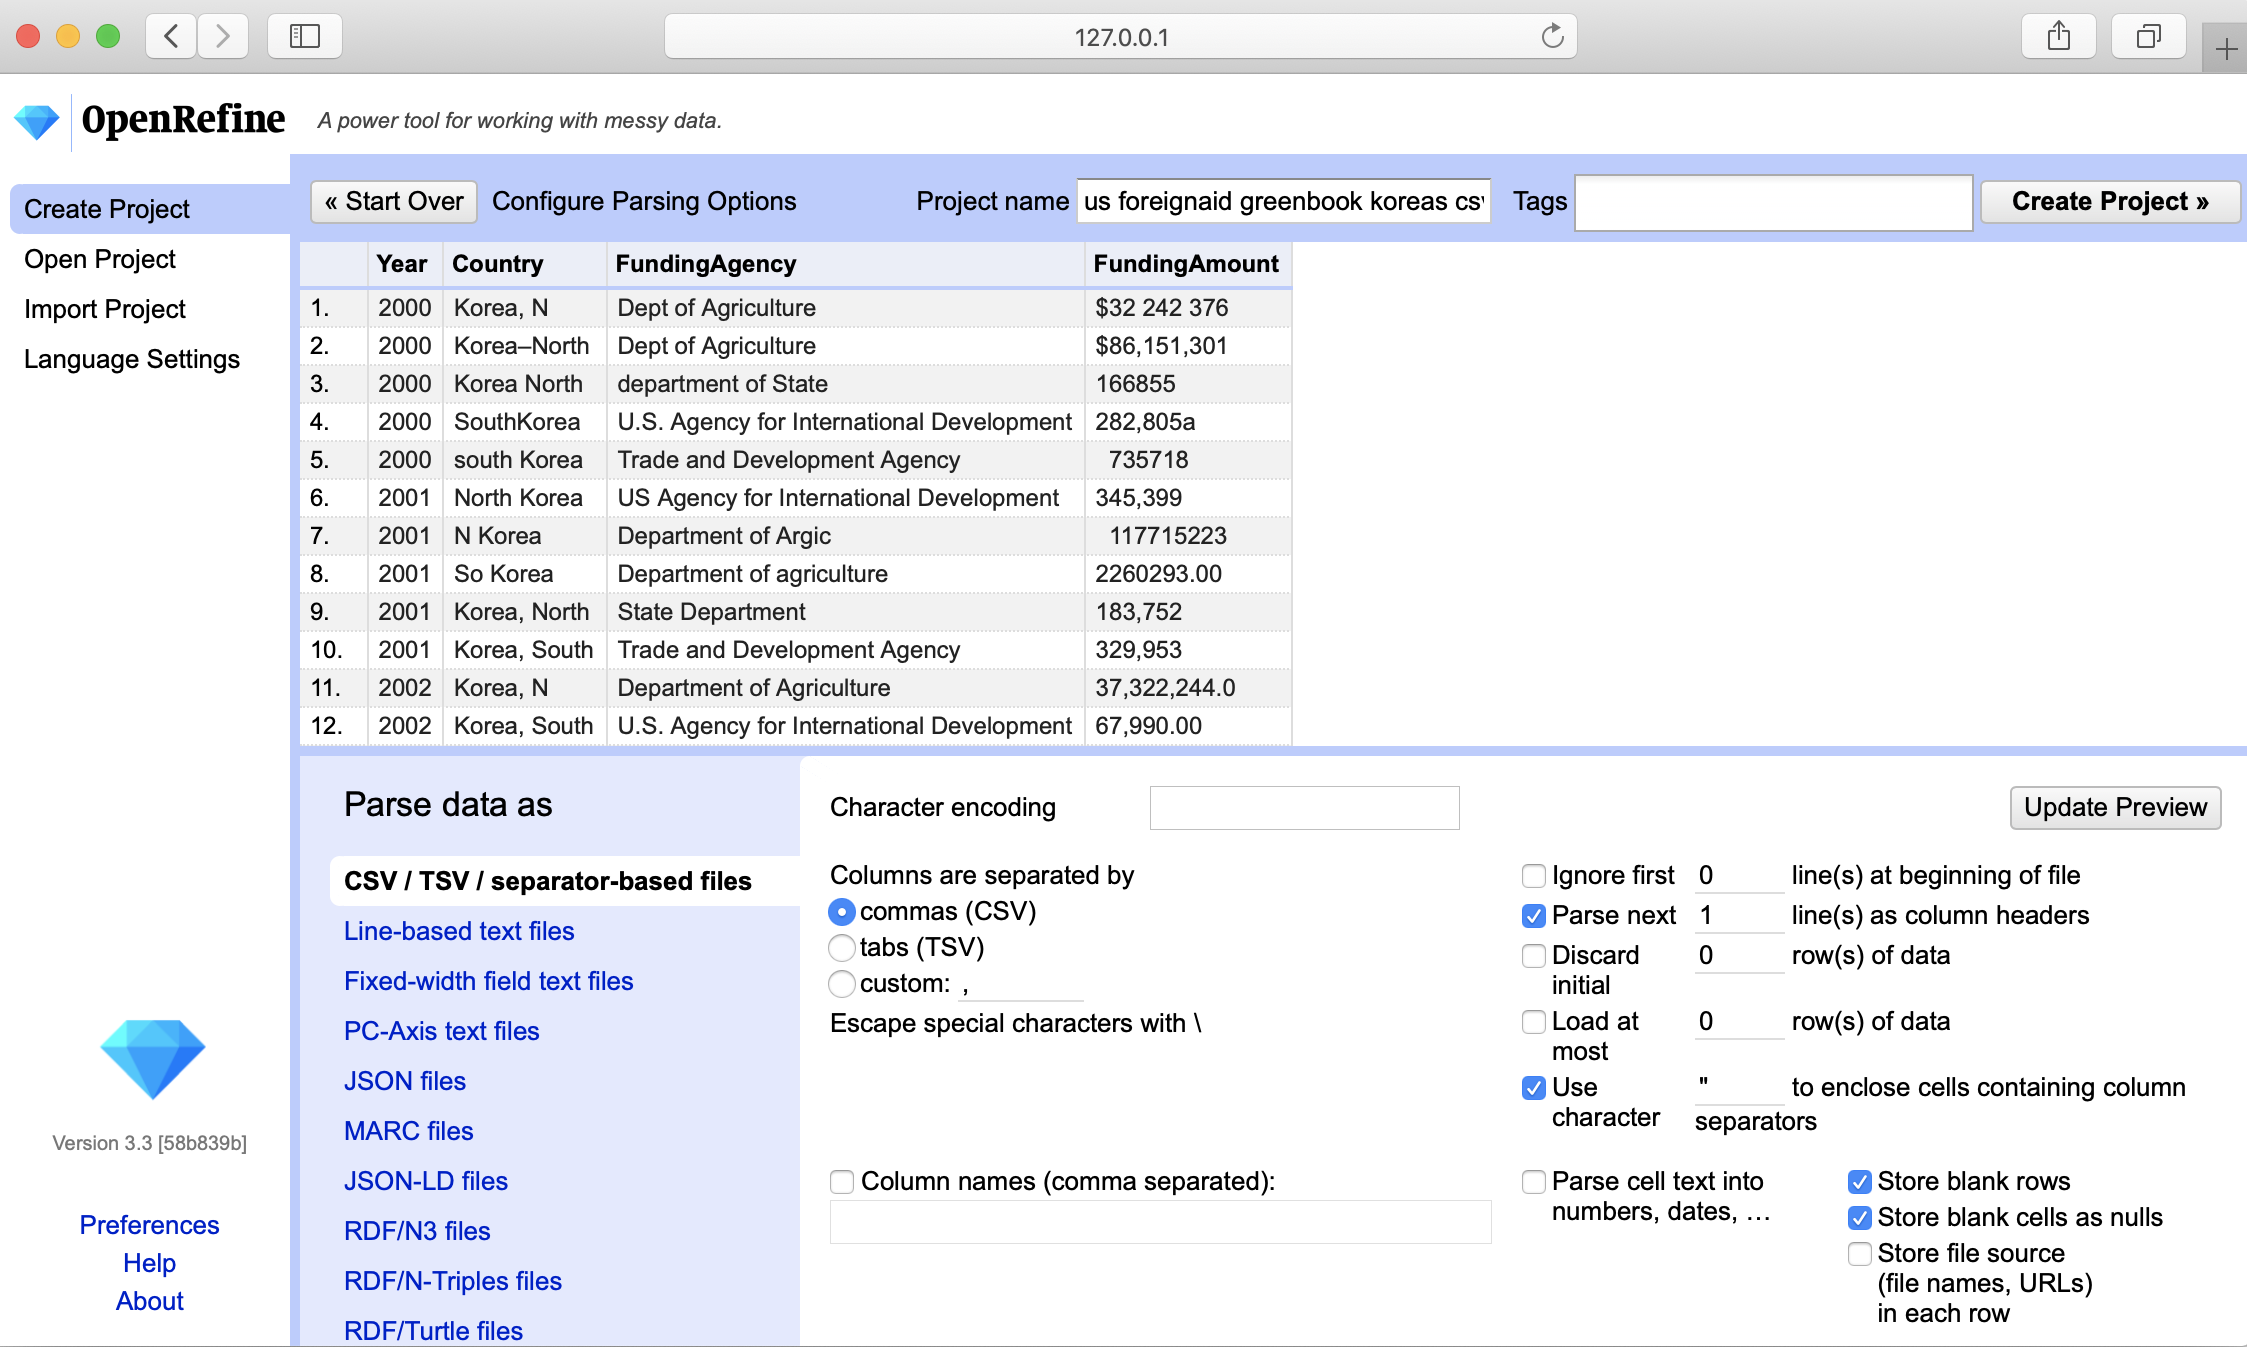
Figure 4.16: OpenRefine parsing options.
Now when you’ve successfully read the data into a new project, let’s start the fun part: converting text into numbers, removing unnecessary characters, and fixing the spellings for North and South Koreas.
Convert Dollar Amounts from Text to Numbers
Once your project is created, you will see the first 10 rows of the dataset. You can change it to 5, 10, 25, or 50 by clicking the appropriate number in the header
Each column header has its own menu, which you can select by clicking its arrow-down button. Left-aligned numbers in a column are likely represented as text, as is our case with the FundingAmount column, and they need to be transformed into numeric format.
- To transform text into numbers, select the FundingAmount column menu, and go to Edit cells > Common transforms > To number, as shown in Figure 4.17.
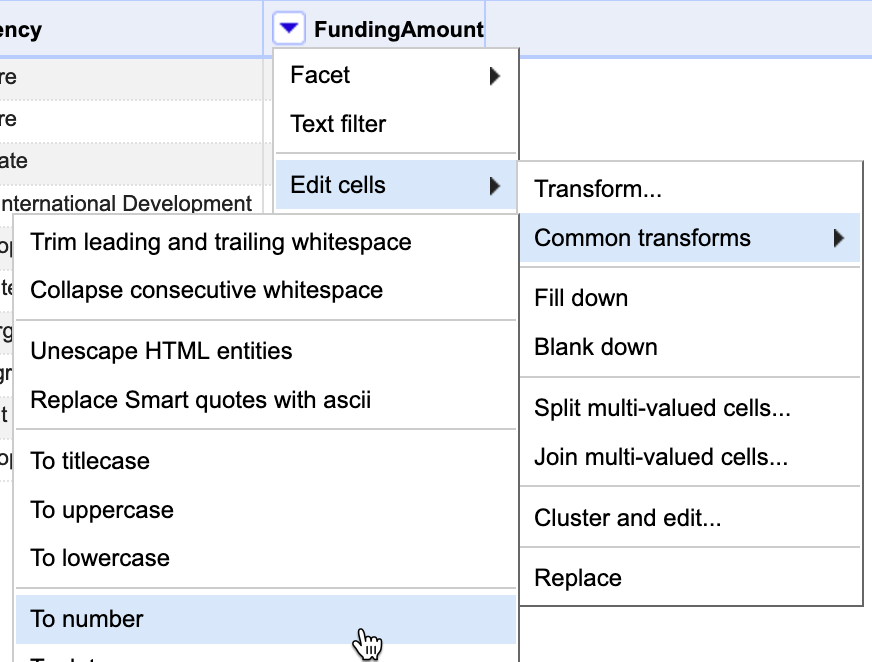
Figure 4.17: In the FundingAmount column menu, select Edit cells - Common transforms - To number.
You will see that some numbers became green and right-aligned, which signals partial success, but most did not change. That is because dollar sign ($) and commas (,) confuse OpenRefine and prevent values to be converted into numbers.
- Let’s remove
$and,from the FundingAmount column. In the column menu, this time select Edit cells > Transform, because we need to manually enter the edit we wish to make. In the Expression window, typevalue.replace(',', '')and notice how commas disappear in the preview window, as shown in Figure 4.18. When you confirm your formula has no syntax errors, click OK
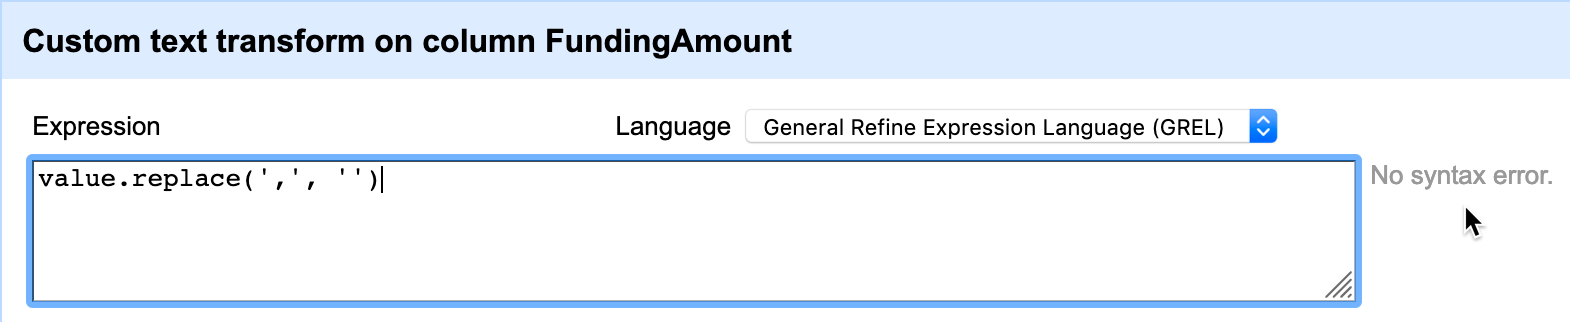
Figure 4.18: Type the expression into the screen, preview the change, and confirm that there are no syntax errors.
Now, repeat the previous step, but instead of a comma, remove the
$character by typing a different expression:value.replace('$', '')), confirm the formula, and click OK.In steps 2 and 3, we replaced text (or string) values with other text values, making OpenRefine think this column is no longer numeric. As a result, all values are once again left-aligned and in black. Perform step 1 again. This time, nearly all of the cells will have turned green, meaning they successfully converted to numeric. But few non-numeric black cells remain.
To fix the remaining non-numeric black cells, we need to remove spaces and an
acharacter at the end of one number. Fix these manually by hovering over a cell, click the Edit button, and in the new popup window, change Data type to number, and press Apply, as shown in Figure 4.19.
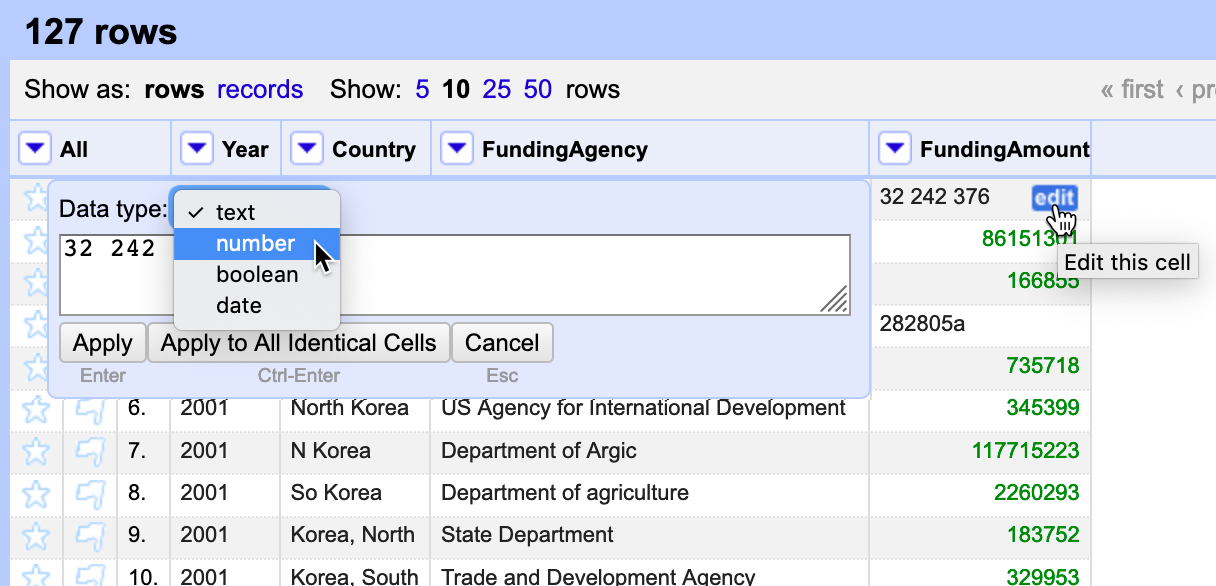
Figure 4.19: Manually edit to remove spaces and extra characters, and change data type to number.
At this point, all funding amounts should be clean numbers, right-aligned and colored in green. We’re ready to move on to the Country column and fix different spellings of Koreas.
Cluster Similar Spellings
When you combine different data sources, or process survey data where respondents wrote down their answers as opposed to selecting them from a dropdown menu, you might end up with multiple spellings of the same word (town name, education level – you name it!). One of the most powerful features of OpenRefine is the ability to cluster similar responses.
If you use our original sample file, take a look at the Country column and all variations of North and South Korea spellings. From Country column’s dropdown menu, go to Facet > Text facet. This will open up a window in the left-hand side with all spellings (and counts) of column values. 26 choices for a column that should have just two distinct values, North Korea and South Korea!
- To begin standardizing spellings, click on the arrow-down button of the Country column header, and choose Edit cells > Cluster and edit. You will see a window like the one shown in Figure 4.20.
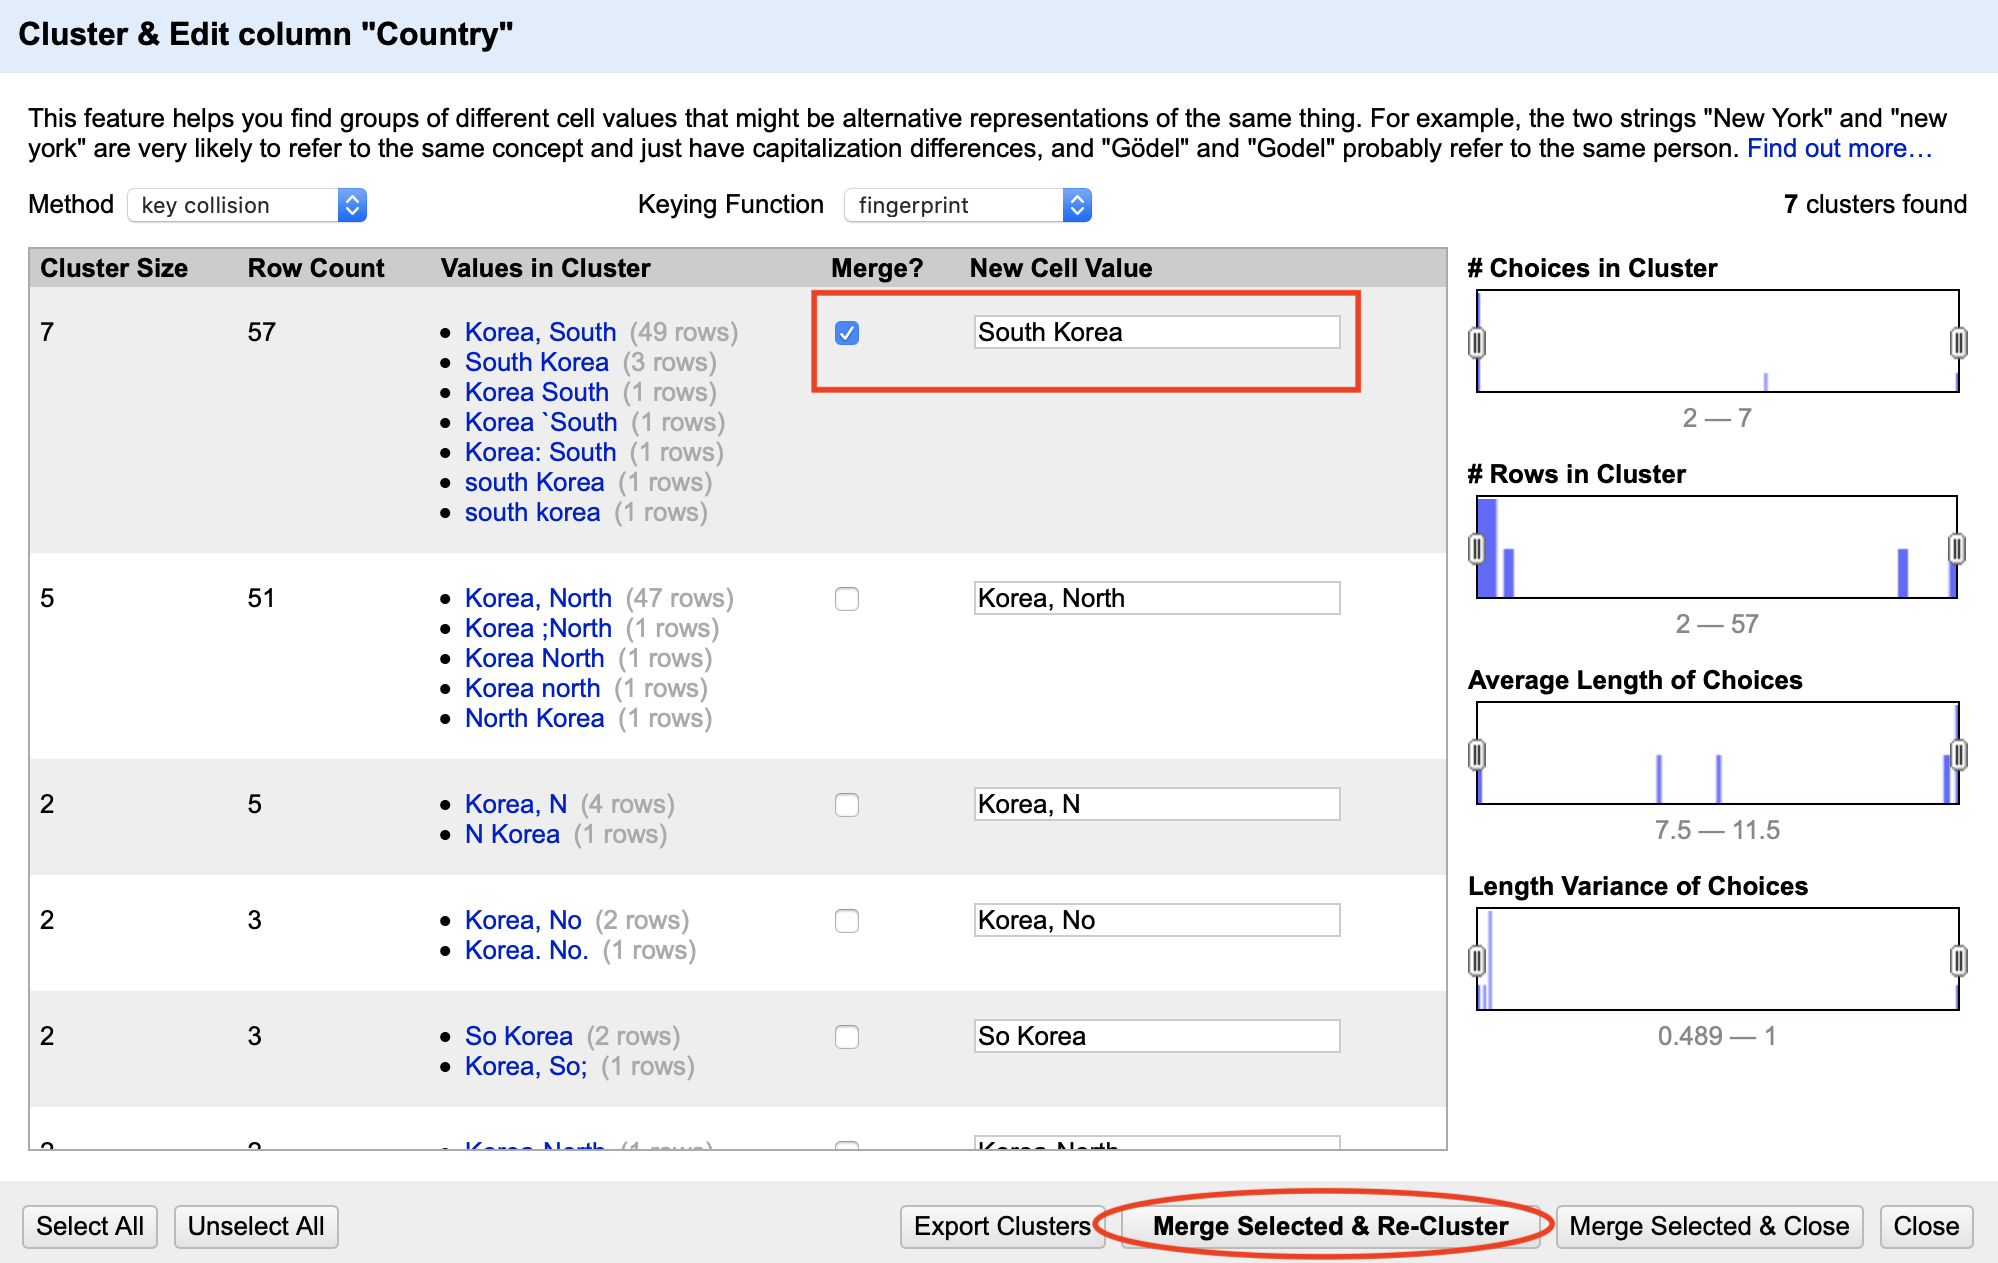
Figure 4.20: Cluster similar text values.
You will have a choice of two clustering methods, key collision or nearest neighbor. Key collision clustering is a much faster technique that is appropriate for larger datasets, but it is less flexible. Nearest neighbor is a more computationally expensive approach and will be slow on larger datasets, but it allows for greater fine-tuning and precision. Both methods can be powered by different functions, which you can read about on the project’s GitHub Wiki page. For the purpose of this exercise, let’s leave the default key collision method with fingerprint function.
OpenRefine will calculate a list of clusters. The Values in Cluster column contains grouped spellings that OpenRefine considers the same.
If you agree with a grouping, check the Merge? box, and assign the true value to the New Cell Value input box, as shown in the first cluster in Figure 4.20. In our example, this would be either
North KoreaorSouth Korea.You can go through all groupings, or stop after one or two and click the Merge Selected & Re-Cluster button. The clusters you selected will be merged, and grouping will be re-calculated. (Don’t worry, the window won’t go anywhere.) Keep regrouping until you are happy with the result.
Spend some time playing with Keying function parameters, and notice how they produce clusters of different sizes and accuracy.
- After you are done cleaning up and clustering data, save the clean dataset by clicking Export button in the upper-right corner of OpenRefine window. You can choose your format (we recommend CSV, or comma-separated value). Now you have a clean dataset that is ready to be analyzed and visualized.
Summary
In this chapter, we looked at cleaning up tables in Google Sheets, liberating tabular data trapped in PDFs using Tabula, and using OpenRefine to clean up very messy datasets. You will often find yourself using several of these tools on the same dataset before it becomes good enough for your analysis. We encourage you to learn more formulas in Google Sheets, and explore extra functionality of OpenRefine in your spare time. The more clean-up tools and techniques you know, the more able and adaptable you become to tackle more complex cases.
You now know how to clean up your data, so let’s proceed to the next step before visualizing it. In the following chapter, we’ll talk about why you should normalize data and use precise language to make meaningful comparisons.