#StandWithUkraine - Stop the Russian invasion
Join us and donate. Since 2022 we have contributed over $5,000 in book royalties to Save Life in Ukraine & Ukraine Humanitarian Appeal & The HALO Trust, and we will continue to give!
Edit and Join with Mapshaper
Like GeoJson.io, Mapshaper is a free, open-source editor that can convert geospatial files, edit attribute data, filter and dissolve features, simplify boundaries to make files smaller, and many more. Mapshaper’s edit and join commands are much more powerful than the GeoJson.io tool. Unlike GeoJson.io, Mapshaper doesn’t have drawing tools, so you won’t be able to create geospatial files from scratch.
Mapshaper is developed and maintained by Matthew Bloch on GitHub. This easy-to-learn web tool has replaced many of our map preparation tasks that previously required expensive and hard-to-learn ArcGIS software, or its free but still-challenging-to-learn cousin, QGIS. Even advanced GIS users may discover that Mapshaper can be a quick alternative for some common but time-consuming tasks.
Import, convert, and export map boundary files
You can use Mapshaper to convert between geospatial file formats. Unlike GeoJson.io, Mapshaper also allows you to upload Esri Shapefiles, so you can easily convert them into the web-friendly GeoJSON format. In the following steps, we will convert a geospatial file by importing it to Mapshaper, and then exporting it as a different file type.
Tip: Mapshaper doesn’t work with KML or KMZ files, but you can use GeoJson.io to first convert them into GeoJSON format, then upload to Mapshaper.
Navigate to Mapshaper.org. The start page is two large drag-and-drop zones which you can use to import your file. The smaller area at the bottom, Quick import, uses default import settings and is a good way to begin.
Drag and drop your geospatial file to the Quick import area. For this exercise, you can download our US states shapefiles in .zip format, which is a compressed archive that contains four shapefiles.
Note: If you want to import a folder of shapefiles, you need to either select all files inside that folder
and drop them all together to the import area, or upload all of them inside a compressed .zip archive.
Each imported file becomes a layer, and is accessible from the dropdown menu in the top-middle of the browser window. There, you can see how many features each layer has, toggle their visibility, or delete them.
To export, go to Export in the upper-right corner, and select a desired file format. The choice of export formats is shown in Figure 13.8. Currently, available formats are Shapefile, GeoJSON, TopoJSON (similar to GeoJSON, but with topographical data), JSON records, CSV, or SVG (Scalable Vector Graphics, for web and print). If you export more than one layer at a time, Mapshaper will archive them first, and you will download an
output.zipthat contains all exported layers.
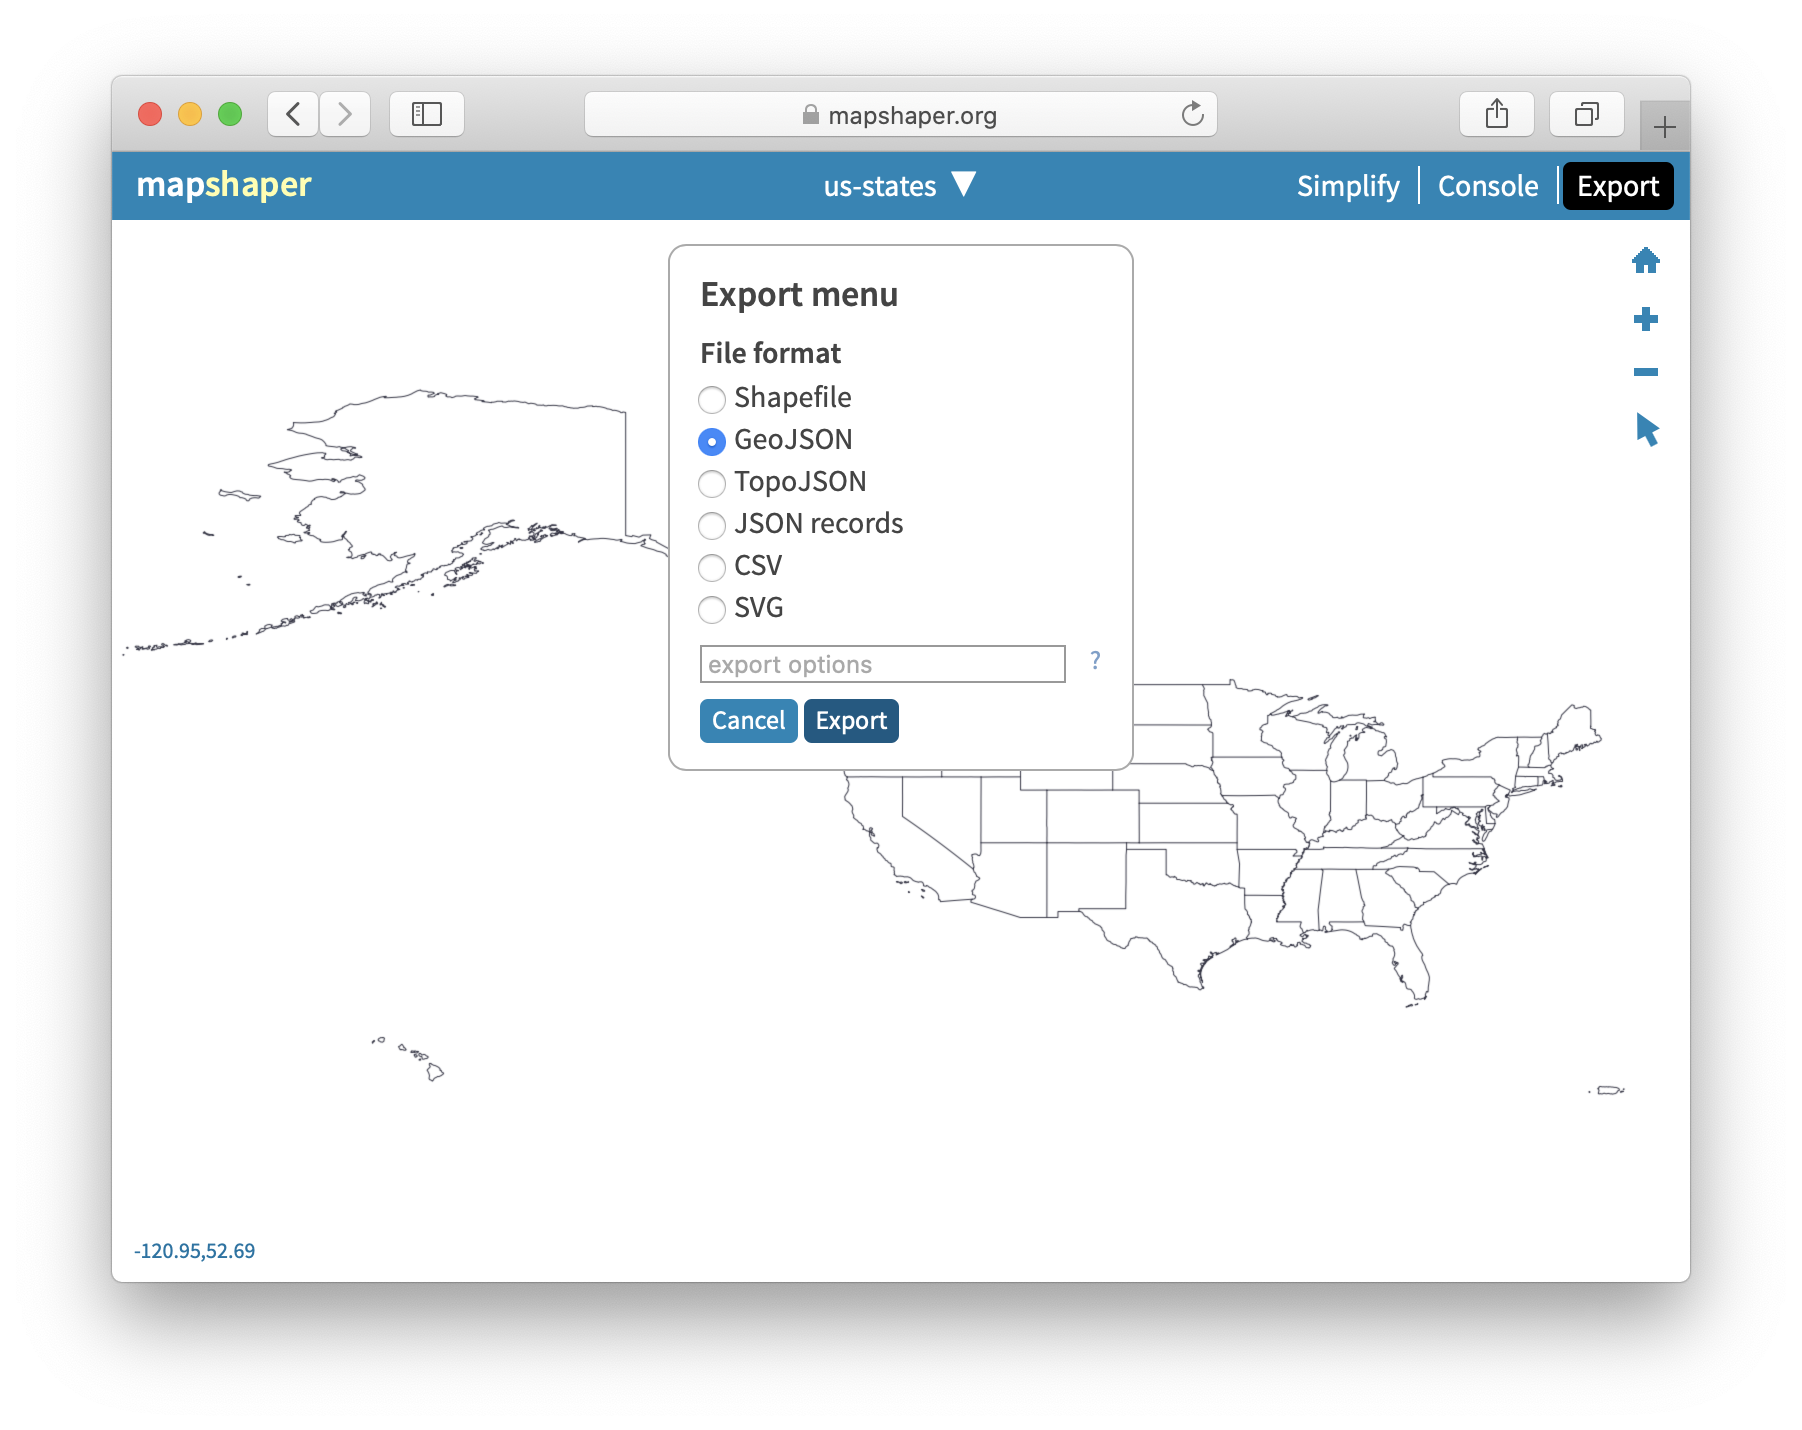
Figure 13.8: You can use Mapshaper to quickly convert between geospatial file formats.
Tip: In Mapshaper, when you export a file in GeoJSON format, your downloaded file will appear in the .json format by default, but several tools and templates in this book only recognize a properly-named .geojson file. Here are two different methods to address this issue. In the first method, when you Export your file from Mapshaper, select GeoJSON and also enter extension='.geojson' in the command line options field near the bottom of the export menu, as shown in Figure 13.9. The second method is to simply rename the file after you export it by changing the extension from .json to .geojson format, as shown in Figure 13.10.
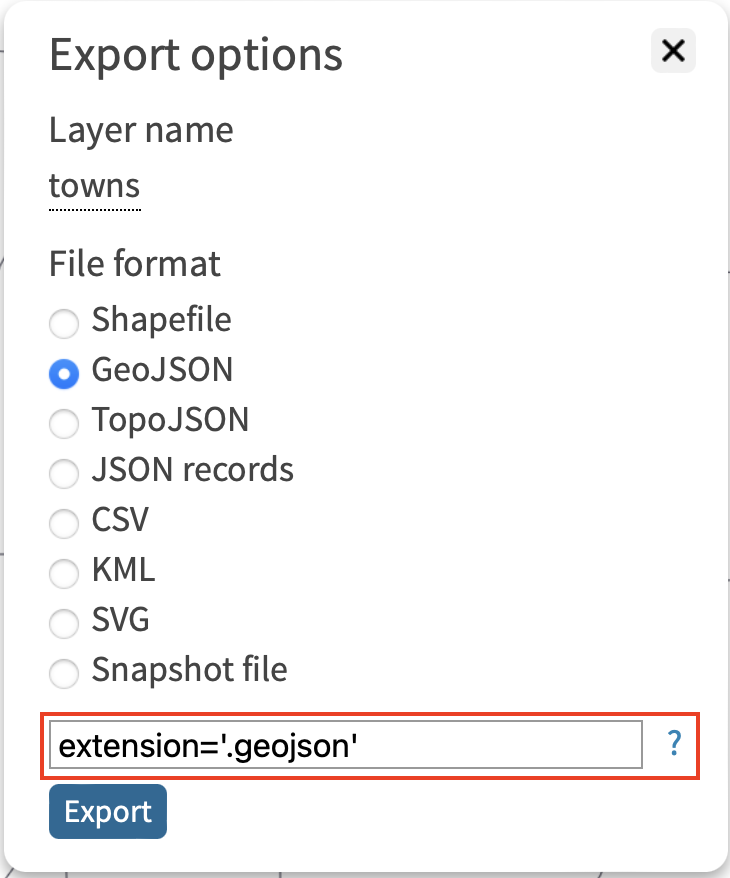
Figure 13.9: First method: enter extension='.geojson' in the Export command line options
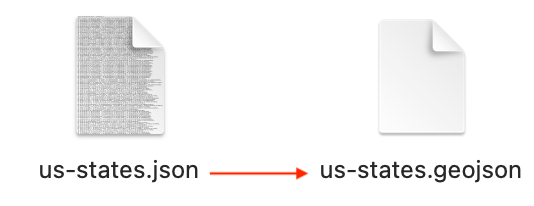
Figure 13.10: Second method: rename your Mapshaper exports from .json to .geojson.
Edit data for specific polygons
You can edit attribute data of individual polygons (and also points and lines) in Mapshaper, as shown in Figure 13.11.
Import the file whose polygon attributes you want to edit.
Under the cursor tool, select edit attributes.
Click on the polygon you want to edit. A pop-up will appear in the upper-left corner listing all attributes and values of the polygon.
Click on any value (underlined, in blue) and edit it.
When you are done, export your geospatial file by clicking Export and choosing the desired file format.
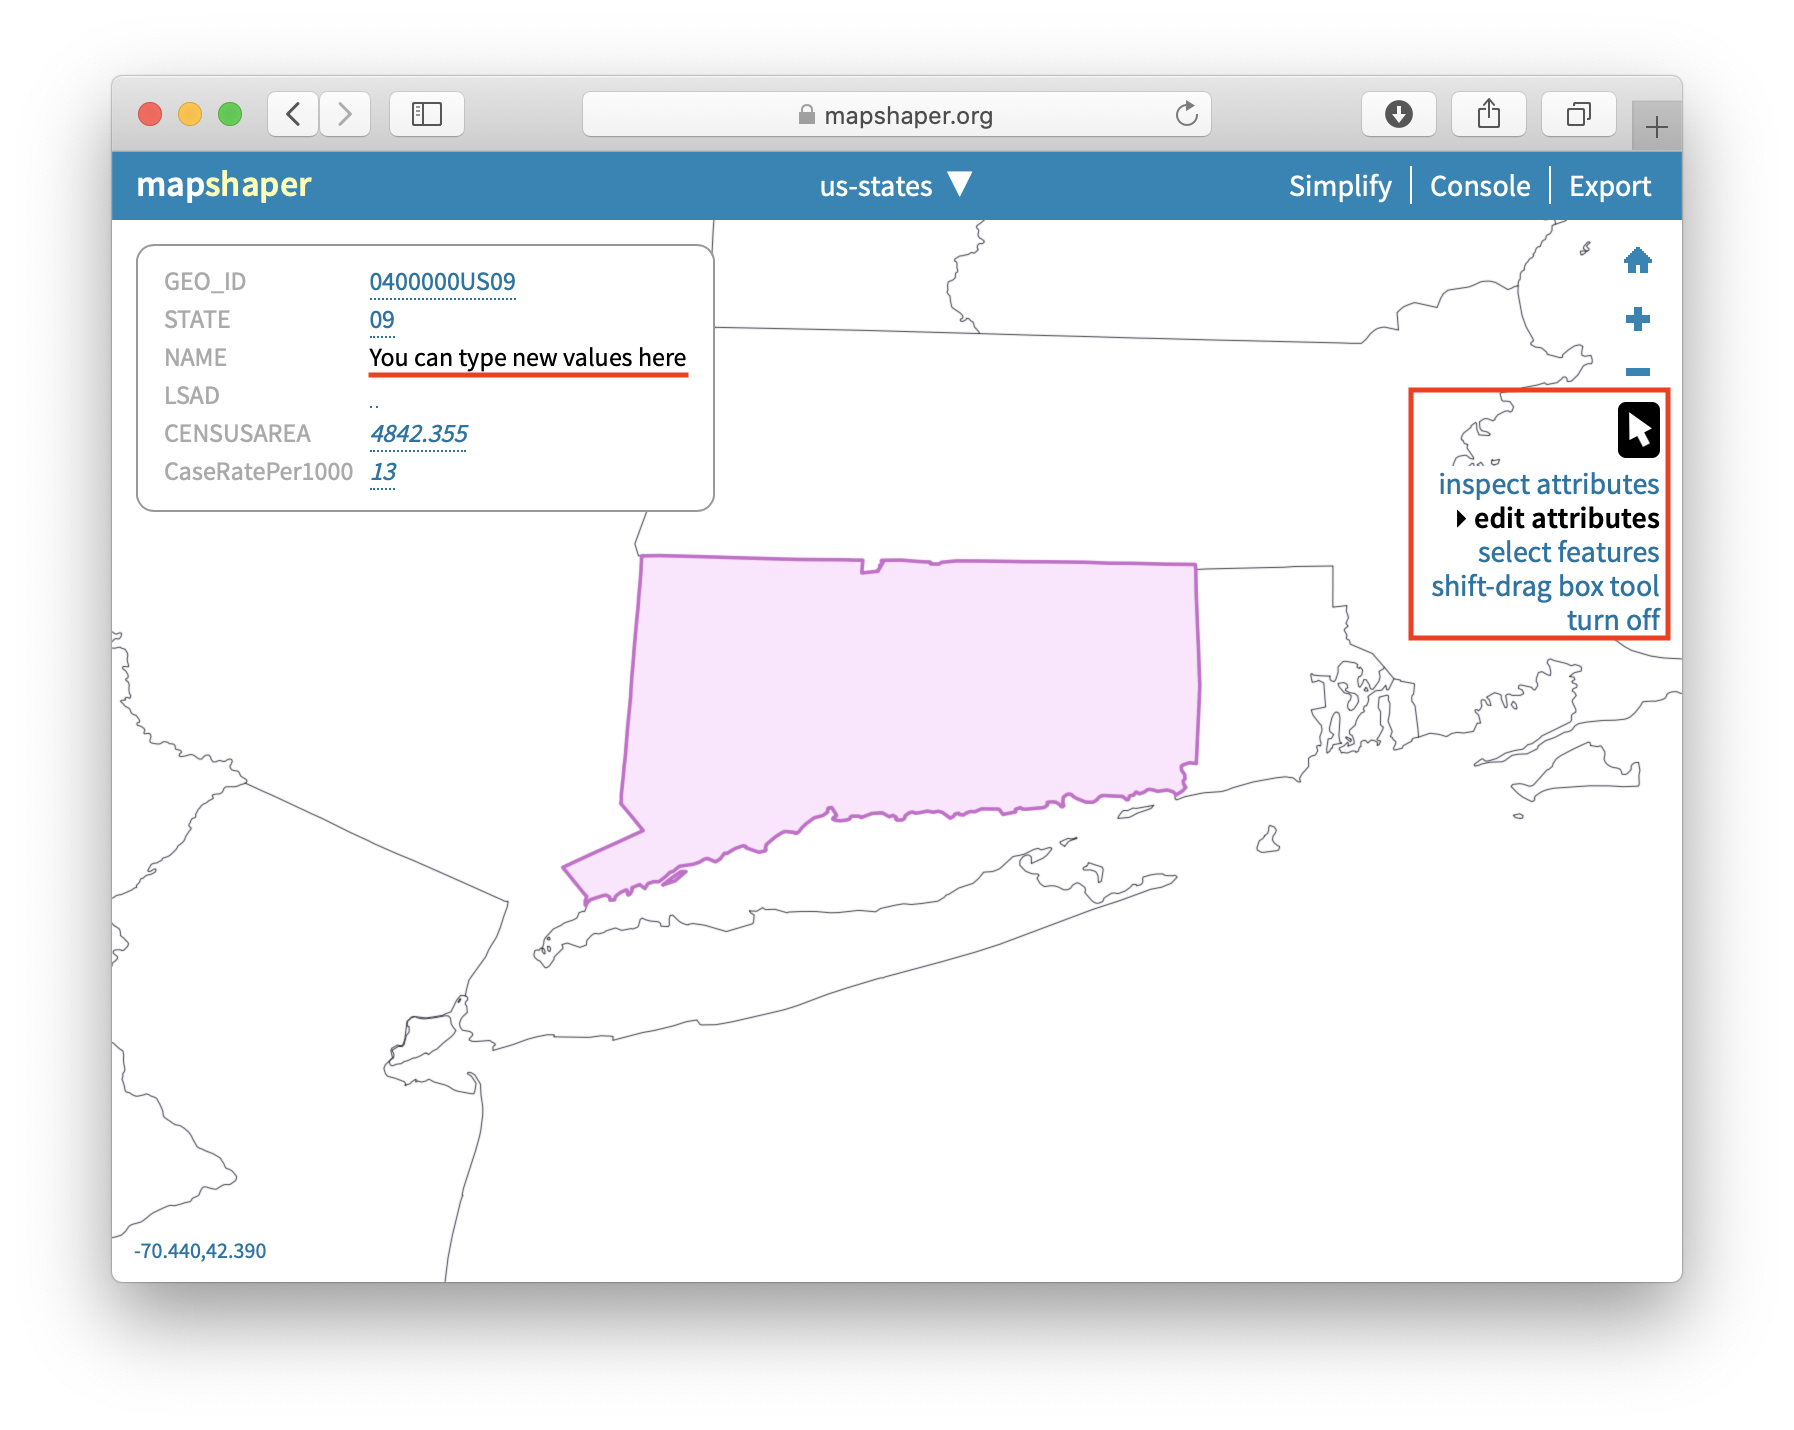
Figure 13.11: Use edit attributes tool (under Cursor tool) to edit attributes of polygons, lines, and points.
Rename data fields
Mapshaper’s most powerful tools are available through the Console button at the top, which opens a window where you can type commands for common map editing tasks.
Sometimes map features (such as points, polylines, and polygons) contain attributes (data fields or columns) with long or confusing names. In the Mapshaper Console, you can easily change field names by entering the rename command in this generic format:
-rename-fields NewName=OldName
First, select the inspect features arrow symbol in Mapshaper and float your cursor over map features to view their field names, then click open the Console windows, as shown in Figure 13.12. In this example, to change the longer field name (STATE_TITLE) to a shorter one (name), enter this command into the console:
-rename-fields name=STATE_TITLE
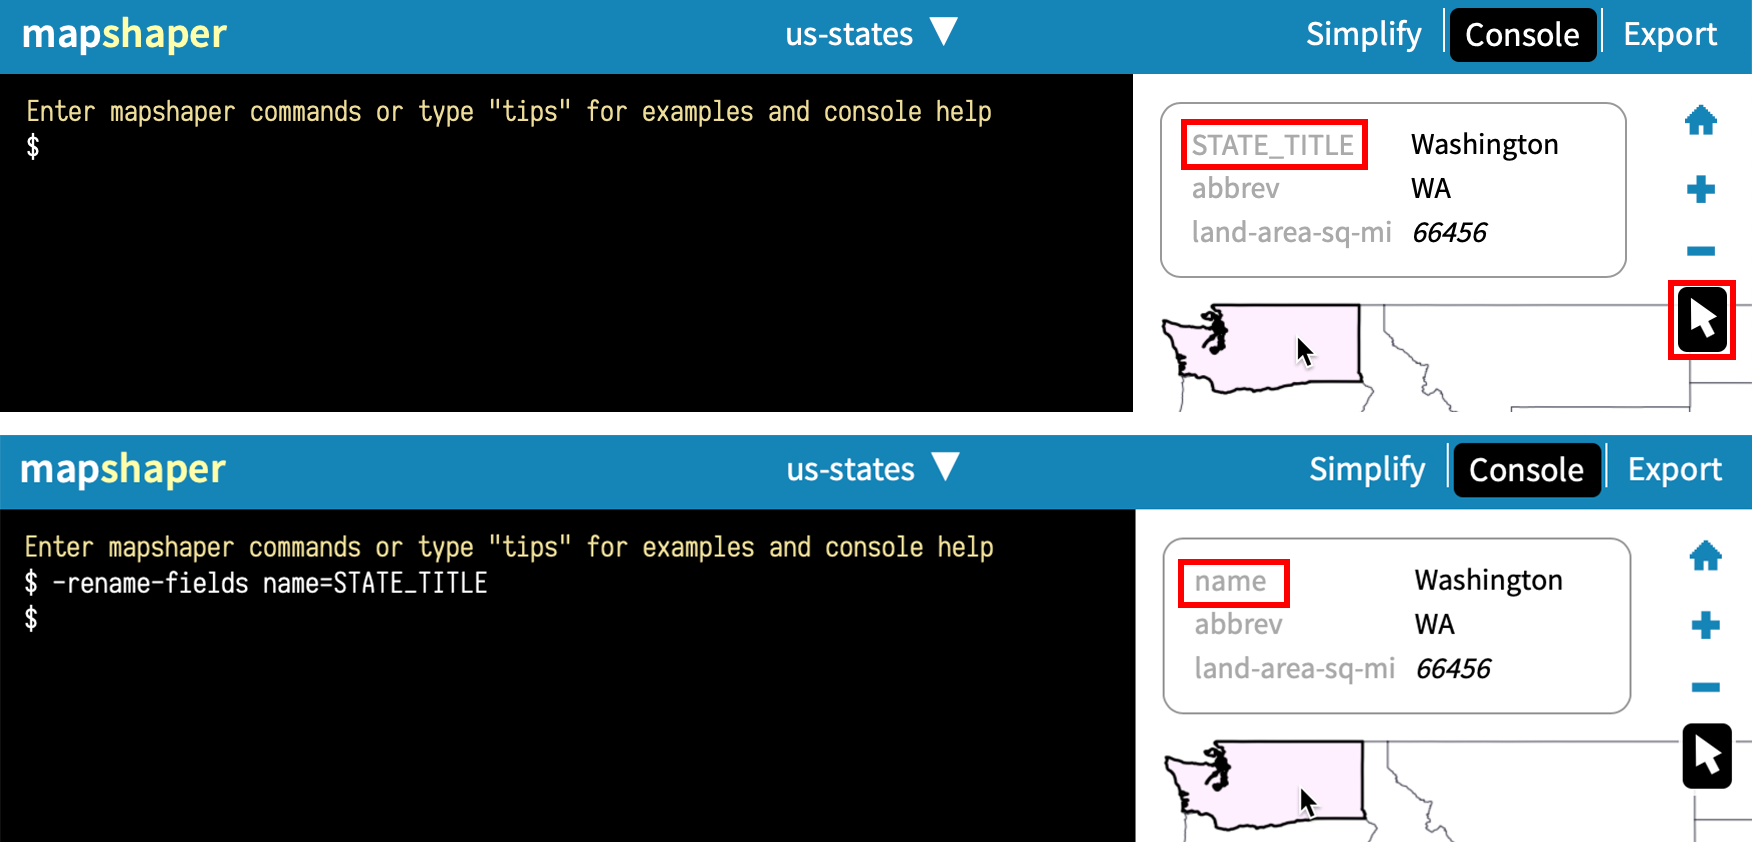
Figure 13.12: Select the inspect features arrow to view field names, and rename them using the -rename-fields command in the console.
Remove unwanted data fields
Sometimes map features contain unwanted attributes (data fields or columns) that you want to remove, which you can easily do with the -filter-fields command in the Mapshaper console.
For example, this command removes all fields except town:
-filter-fields town
If you want to leave more than one field, separate them by a comma, but without spaces, like this:
-filter-fields town,state
Warning: If you leave a space after a comma, you will get a Command expects a single value error.
Simplify map boundaries to reduce file size
When you find GeoJSON maps on the web, they may contain detailed boundaries (especially around coastlines) that increase the file size, which may slow down the performance of your online web maps. Since you do not always need highly-detailed boundaries for data visualization projects with zoomed-out geographies, consider using Mapshaper to simplify your map boundaries. The result will be less precise, but faster to load in user’s browsers.
To understand how to simplify map boundaries, consider two maps of the contiguous US states (also known as the lower 48, the term co-author Ilya learned in 2018 while traveling in Alaska), as shown in Figure 13.13. The map in Figure 13.13a is more detailed and is about 230 kilobytes, but the map in Figure 13.13b is only 37 kilobytes, or six times smaller! However, be careful not to simplify boundaries so much that you remove important features.

Figure 13.13: Consider simplifying geometries with Mapshaper to make your web maps faster.
To simplify map boundaries in Mapshaper, follow the steps below.
Import your geodata file to Mapshaper. You can use the sample contiguous US states in GeoJSON format.
Click the Simplify button in the upper-right corner. The Simplification menu will appear, where you can choose one of three methods. We recommend checking prevent shape removal, and leaving the default Visvalingam / weighted area. Click Apply.
You will see a slider with
100%appear on top (Figure 13.14), replacing the layer selection dropdown. Move the slider to the right and see the map simplify its shape as you go. Stop when you think the map looks appropriate (when the shapes are still recognizable).Mapshaper may suggest to repair line intersections in the upper-left corner. Click Repair.
You can now export your file using the Export feature. Remember to rename an exported GeoJSON file from
.jsonto.geojsonformat.
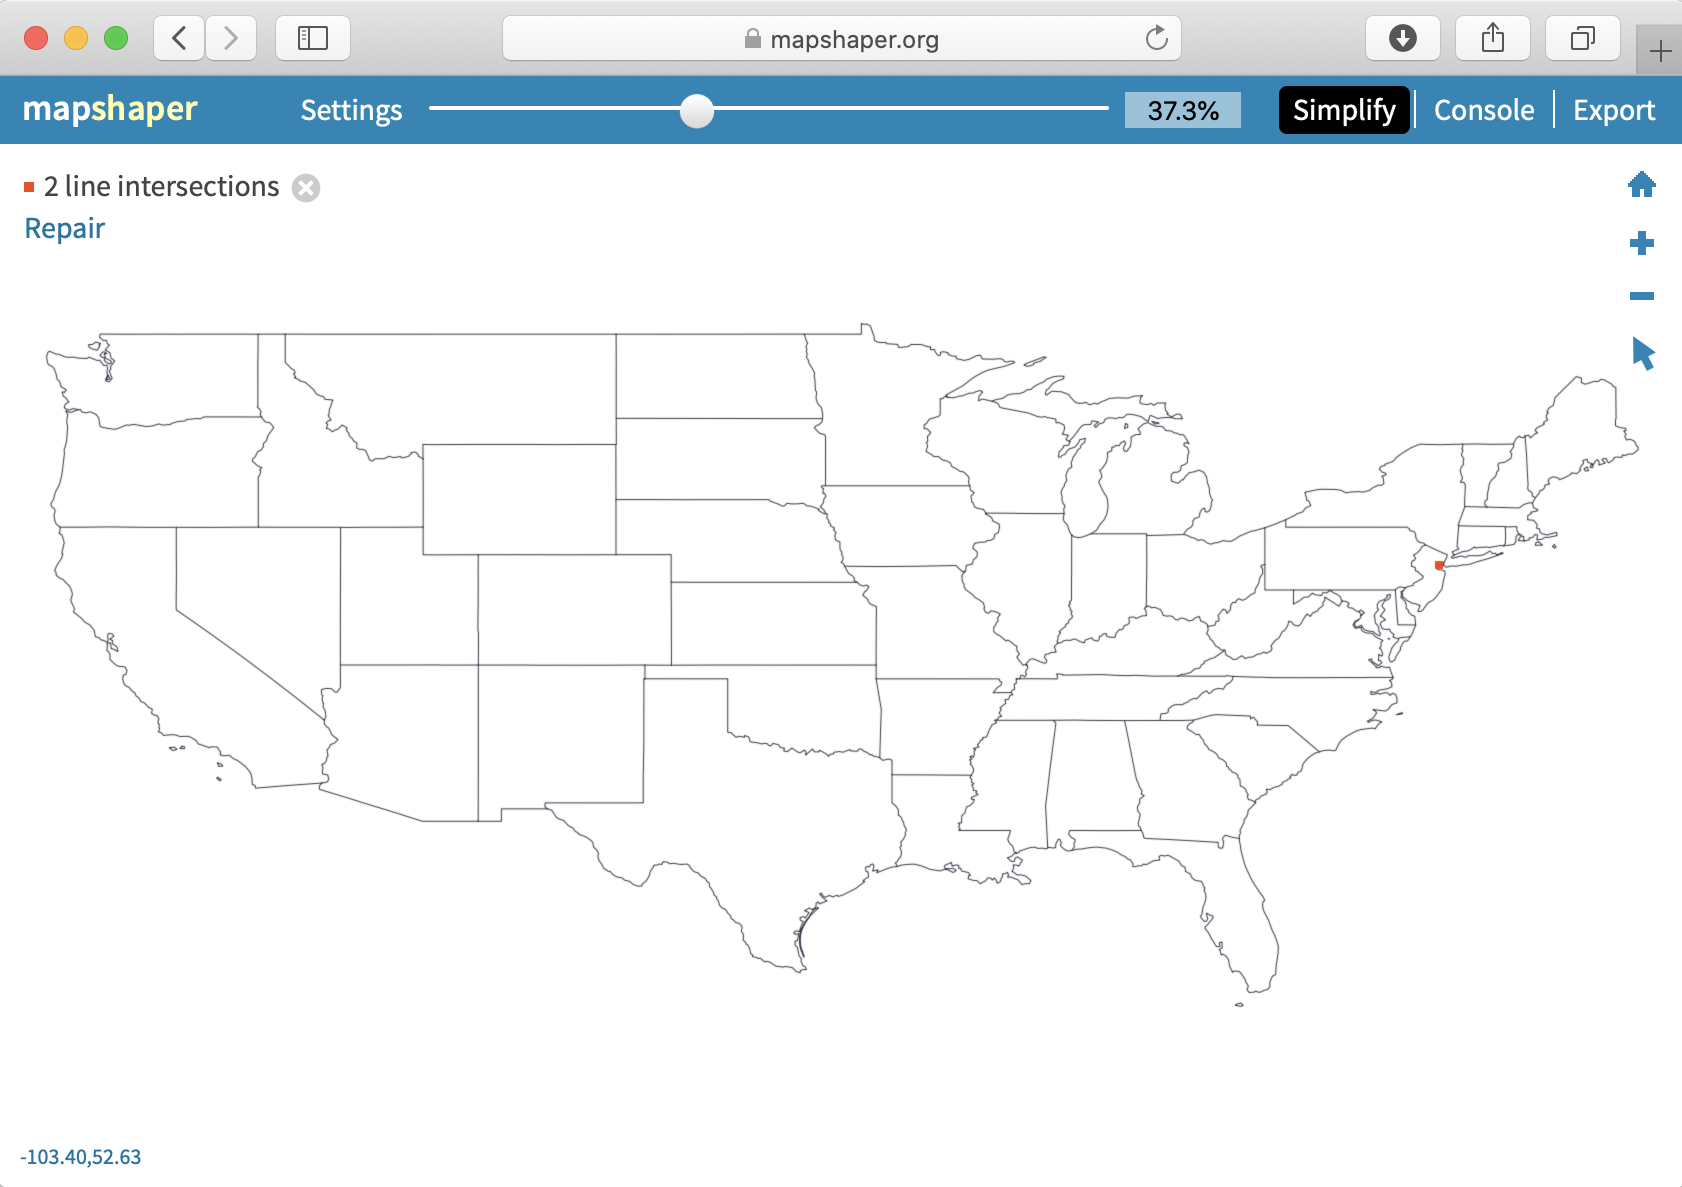
Figure 13.14: Use Simplify & Repair tools in Mapshaper.
Tip: When you upload a geographic file to Mapshaper, you may need to change its projection to align with your visualization tools or related geodata. Click to open the Console and type -proj wgs84 (or -proj EPSG:4326) to change the projection to World Geodetic System 84 (wgs84), the format used by the Global Positioning System (GPS) to display geocoordinates around the world.
Merge and rename map layers
A common map editing task is to combine two separate map layers into one, which you can easily do with a simple Console command in Mapshaper.
Import your first map file into Mapshaper, such as this sample Hartford County, Connecticut GeoJSON file.
Import your second map file, such as this sample Tolland County, Connecticut GeoJSON file, so that you have two separate layers, as shown in Figure 13.15.
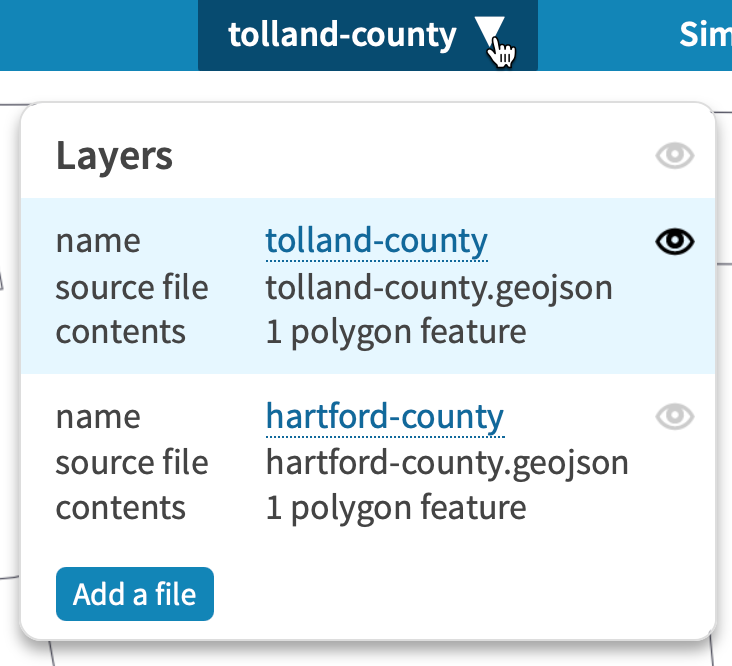
Figure 13.15: Two separate map layers have been imported into Mapshaper.
- Click on Console, which opens a window to type in commands. Enter the merge command as shown below, designate the target layers you wish to merge (separated by a comma and without spaces), then press the Return or Enter key.
-merge-layers target=hartford-county,tolland-county
- Your new merged map will appear as
[unnamed layer]. In the Console window, enter the rename-layers command as shown below to assign it a new name (such ashartford-tollandand without spaces), then press the Return or Enter key, as shown in Figure 13.16.
-rename-layers hartford-tolland
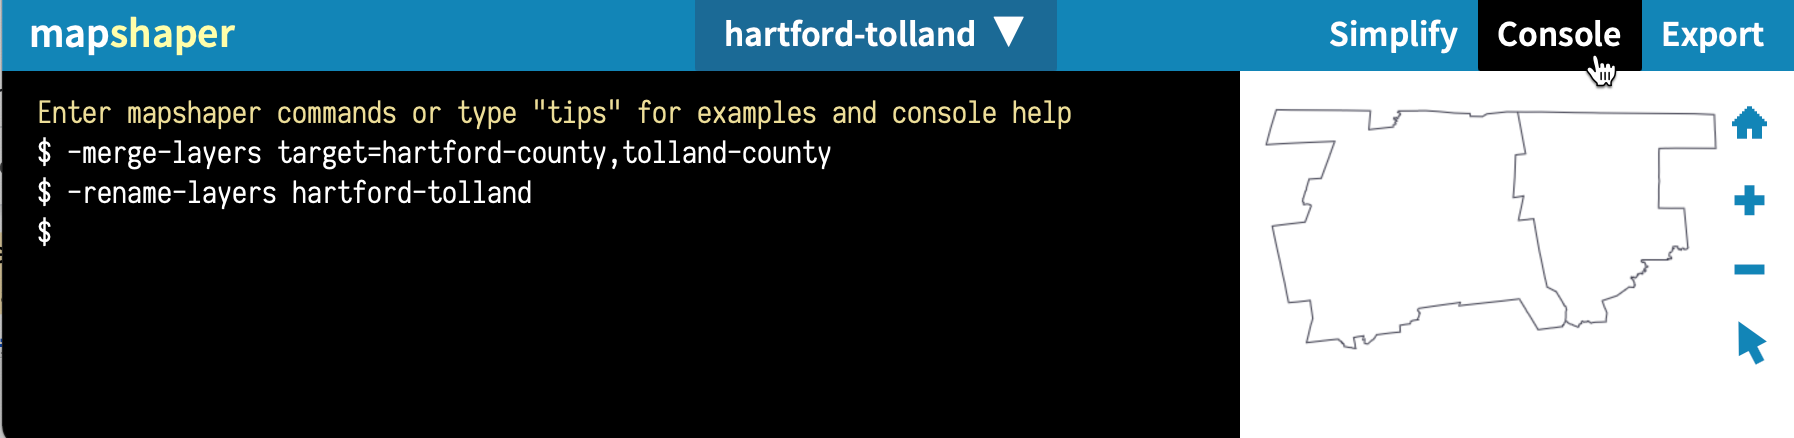
Figure 13.16: Mapshaper allows you to merge and rename map layers.
If you need to dissolve the internal lines between your newly merged polygon map layers, see the next section about the dissolve command.
Dissolve internal polygons to create an outline map
Another common map editing task is to create an outline map by removing the internal boundaries. For example, you can dissolve state boundaries of the US map in the previous exercise to get the outline of the country, as shown in Figure 13.17.
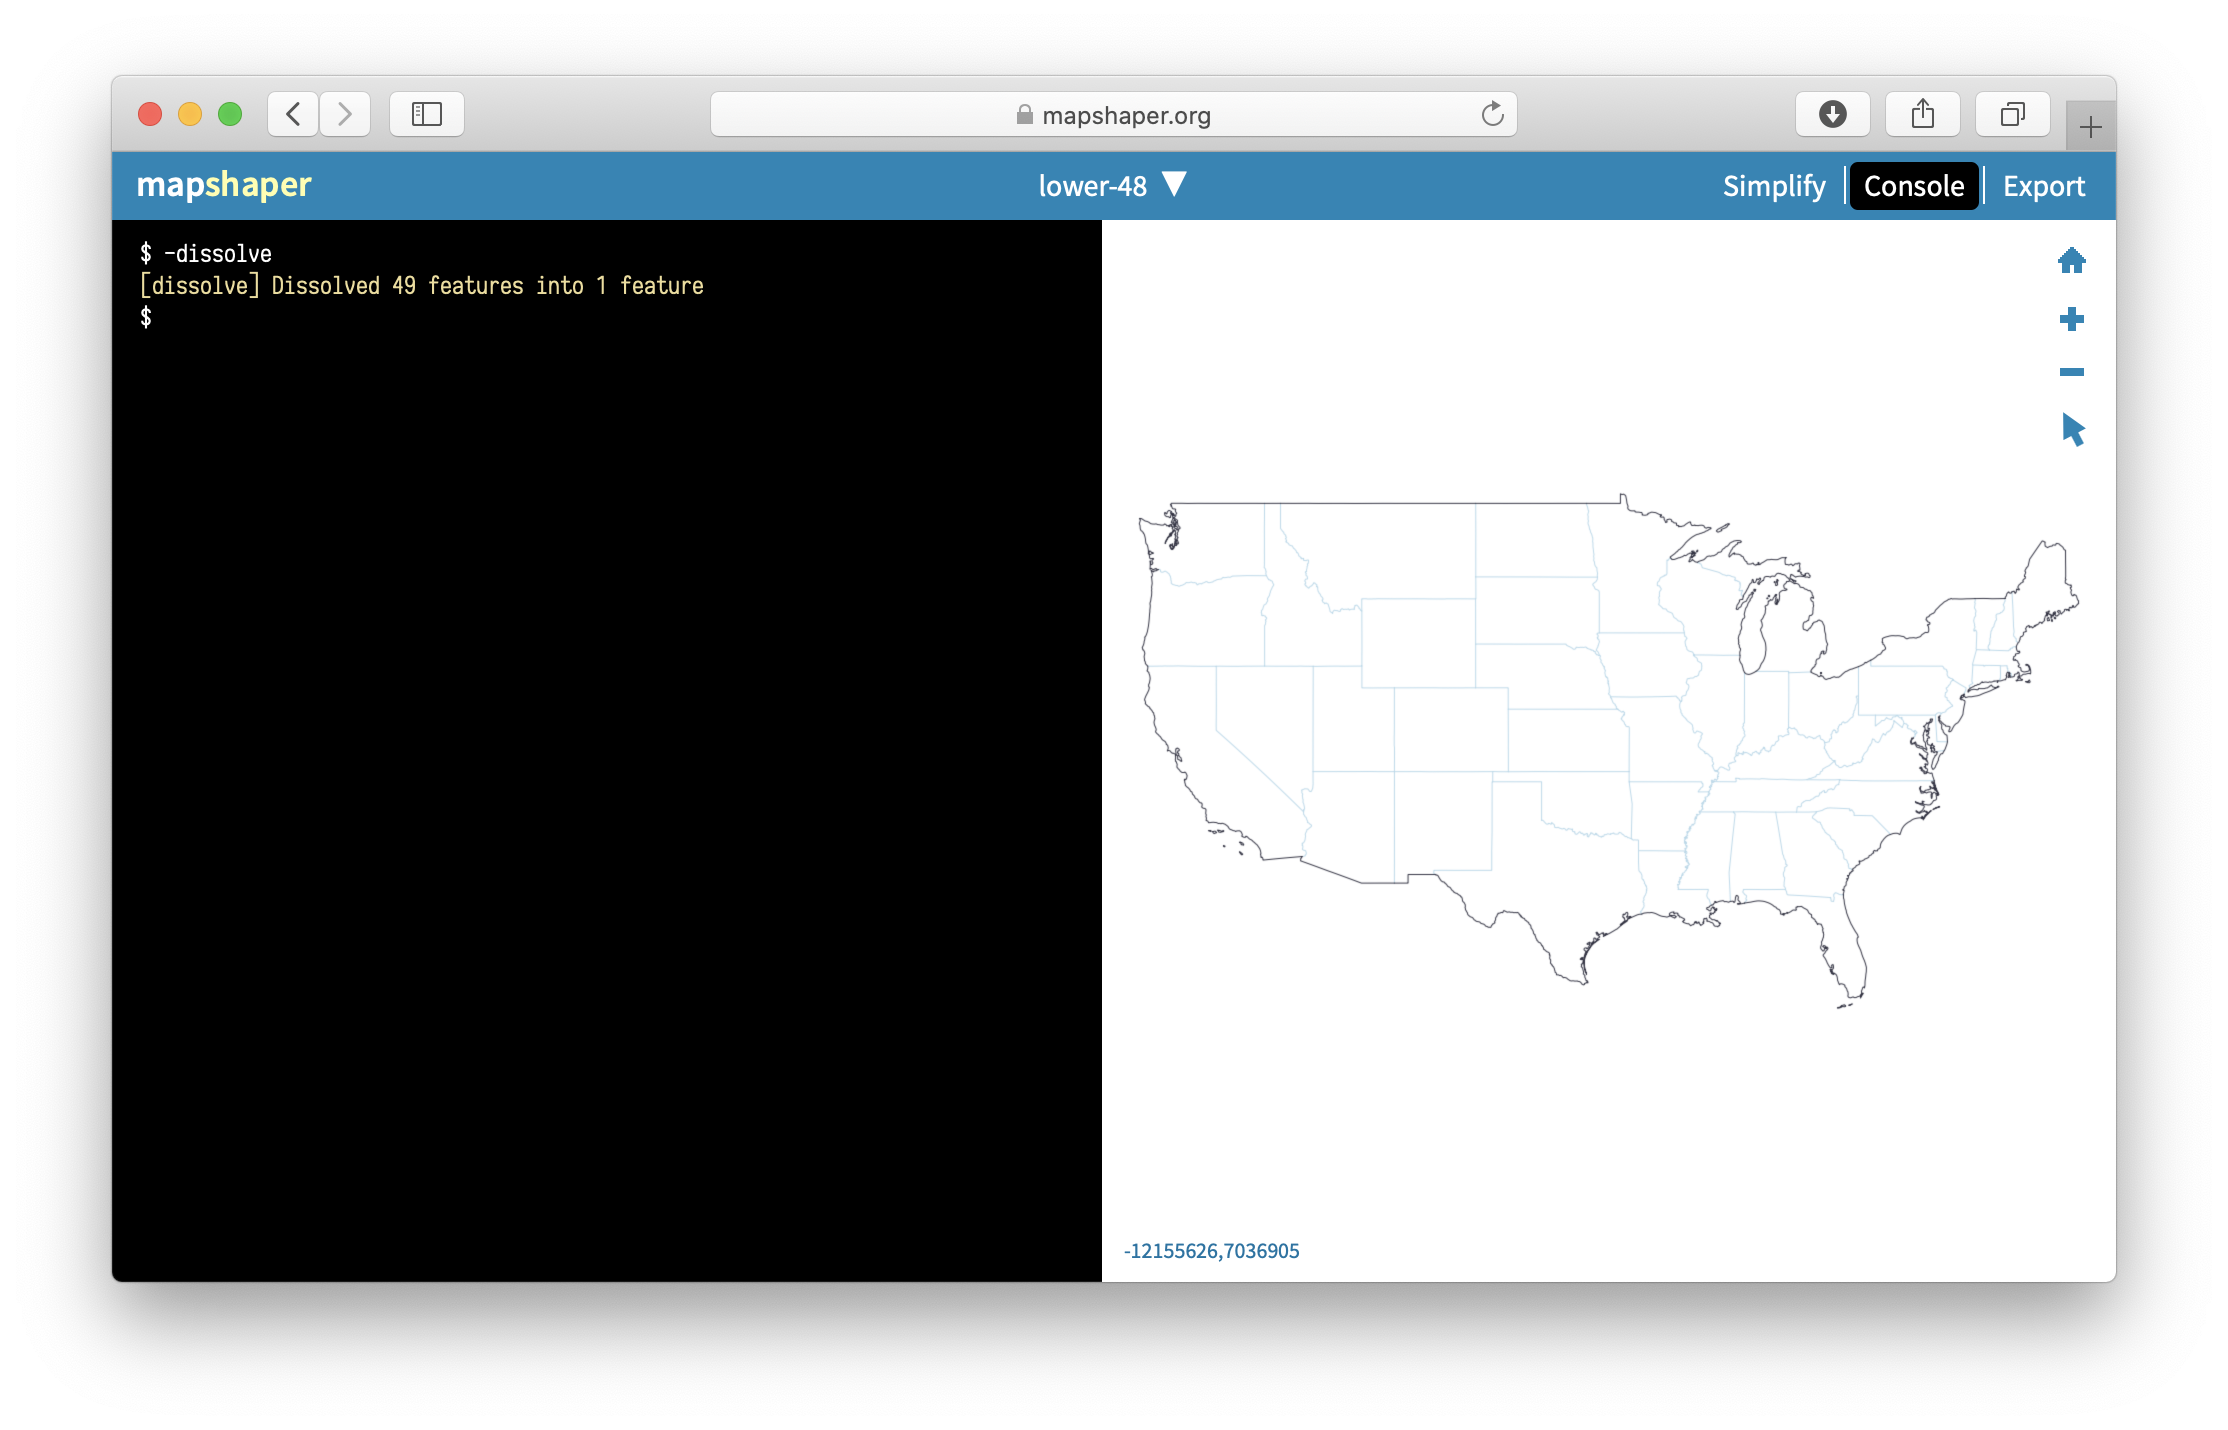
Figure 13.17: Mapshaper lets you dissolve boundaries to create an outline shape.
Click on Console, which opens a window to type in commands. Enter the dissolve command exactly as shown below, then press the Return or Enter key.
-dissolve
You will see that internal boundaries became lighter color, and that’s Mapshaper’s way of saying they no longer exist.
You can now export your outline shape. Remember to rename an exported GeoJSON file from .json to .geojson format.
Clip a map to match an outline layer
Another common map editing task is to “clip” out a smaller portion of a larger map to obtain only the area you need. For example, the State of Connecticut consists of 8 counties, which in turn are divided into a total of 169 towns. Imagine you are given a boundary file of all 169 towns, and the outline of Hartford county. You need to “clip” the original towns map to only include those towns that fall within a specific portion of Connecticut: Hartford County.
Mapshaper allows you to do just that using one simple -clip command.
Import two boundary files into Mapshaper. One is the larger one that is being clipped (if you use sample files, ct-towns), and one is the desired final shape (hartfordcounty-outline). The latter is what ArcGIS calls the “clip feature”.
Make sure your active layer is set to the map you are clipping (ct-towns).
In the Console, type
-clipfollowed by the name of your clip layer, like this:
-clip hartfordcounty-outline
- You should see your active layer got clipped. Sometimes you end up with tiny “slivers” of clipped areas that remain alongside the borders. If that is the case, use a related command to remove them, like this:
-clip hartfordcounty-outline -filter-slivers
- Your Mapshaper state should look like the one pictured in Figure 13.18. You can now save the file on your computer using the Export button. Remember to rename an exported GeoJSON file from
.jsonto.geojsonformat.
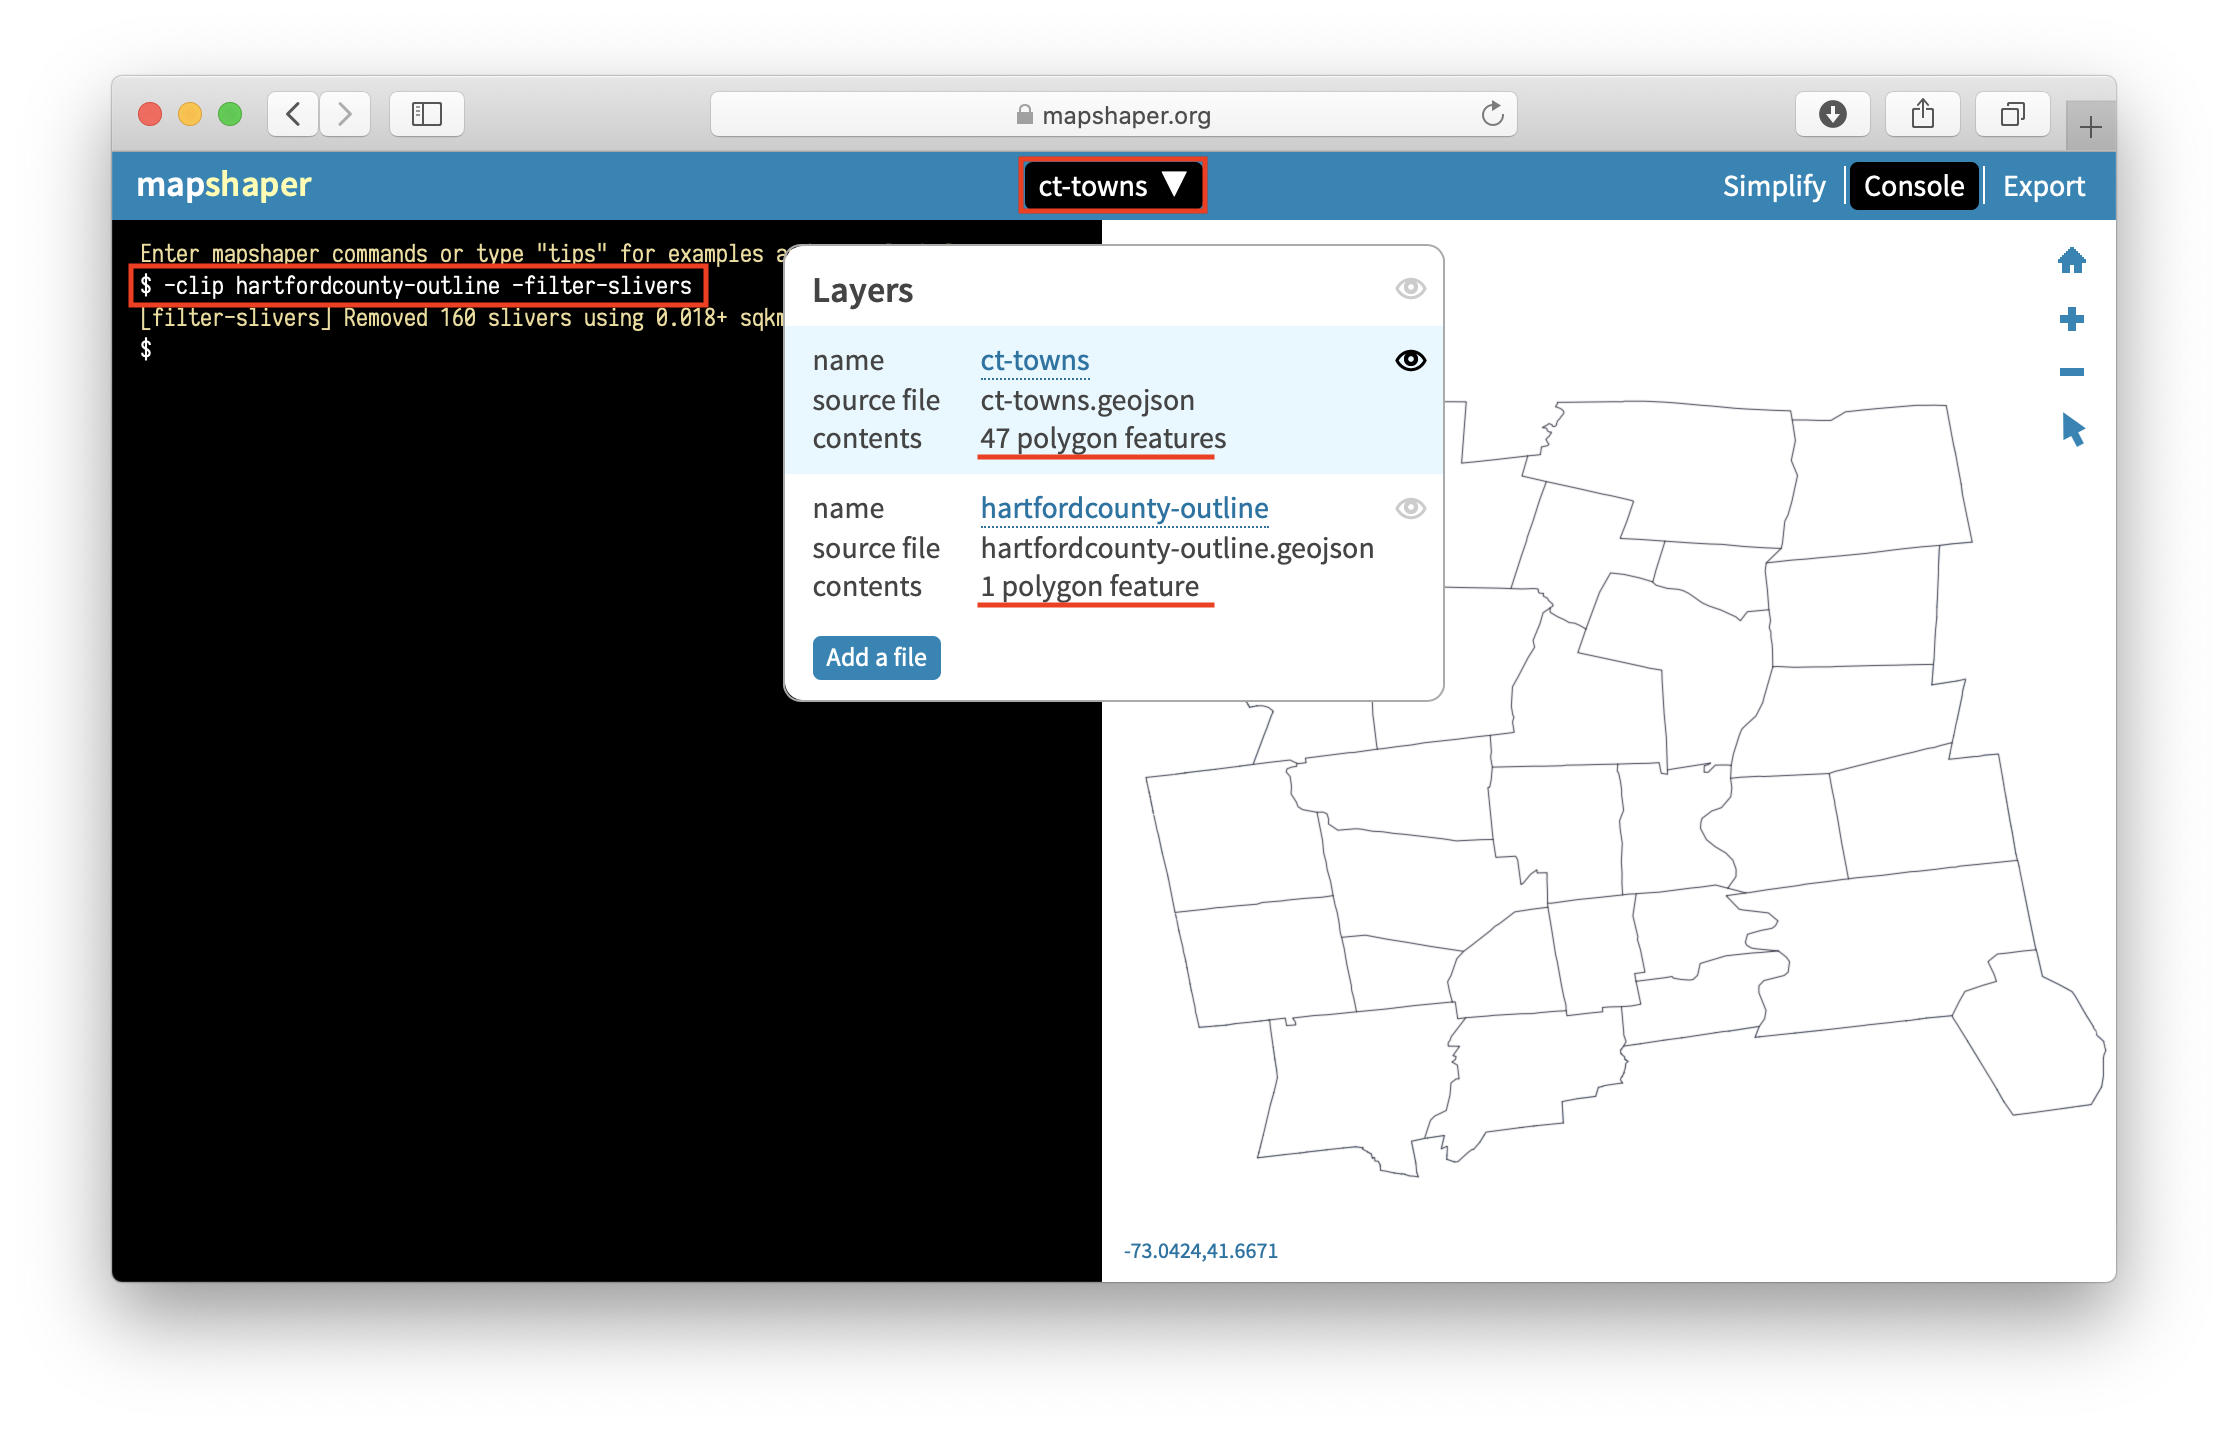
Figure 13.18: When clipping, make sure your active layer is the one being clipped (with many features), not the clipping feature itself.
Join points with polygon map
Joining a spreadsheet of point data with geographical boundaries is also known as a spatial join and is a common task in data visualization. Below we will download two files: a CSV table of points with latitude-longitudue coordinates and a GeoJSON file of census tract boundaries. Our goal is to use Mapshaper’s powerful -join command to answer this question: in which census tract is each charging station located?
Before you start, download this table of Connecticut electric vehicle charging station data, including latitude and longitude coordinates for each location, in CSV format. Note: Safari browser users may need to File > Save As > Format: Page Source to download in CSV format.
Also, download this Connecticut census tracts 2018 boundaries in GeoJSON format. Note: Safari browser users may need to File > Save As > Format: Page Source to download in GeoJSON format.
- Import the CSV point data file you downloaded above into Mapshaper using its Quick import box. Click on the inspect features arrow tool and float over cells to confirm that they contain Latitude and Longitude data columns, as shown in Figure 13.19.
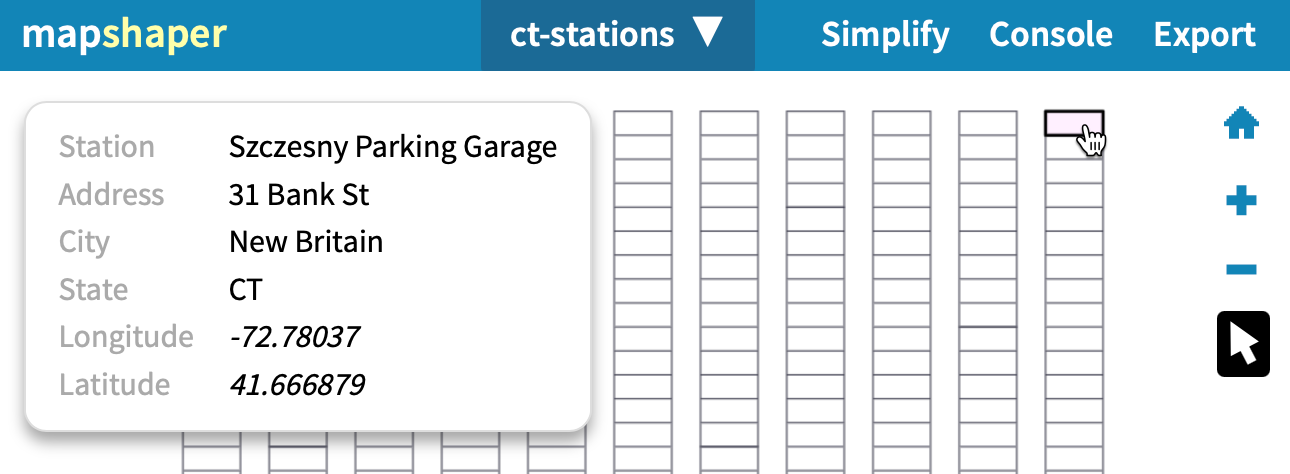
Figure 13.19: Use the inspect features arrow tool to confirm that each CSV cell contains Latitude and Longitude columns.
- Click open the Console window in Mapshaper and enter the points command as shown below to instruct the tool to designate the Longitude and Latitude columns as XY coordinates, then press Return or Enter. Be sure to follow the order below and spell the column headers exactly as they appear in your data. Mapshaper will display them as points on a map, as shown in Figure 13.20.
-points x=Longitude y=Latitude
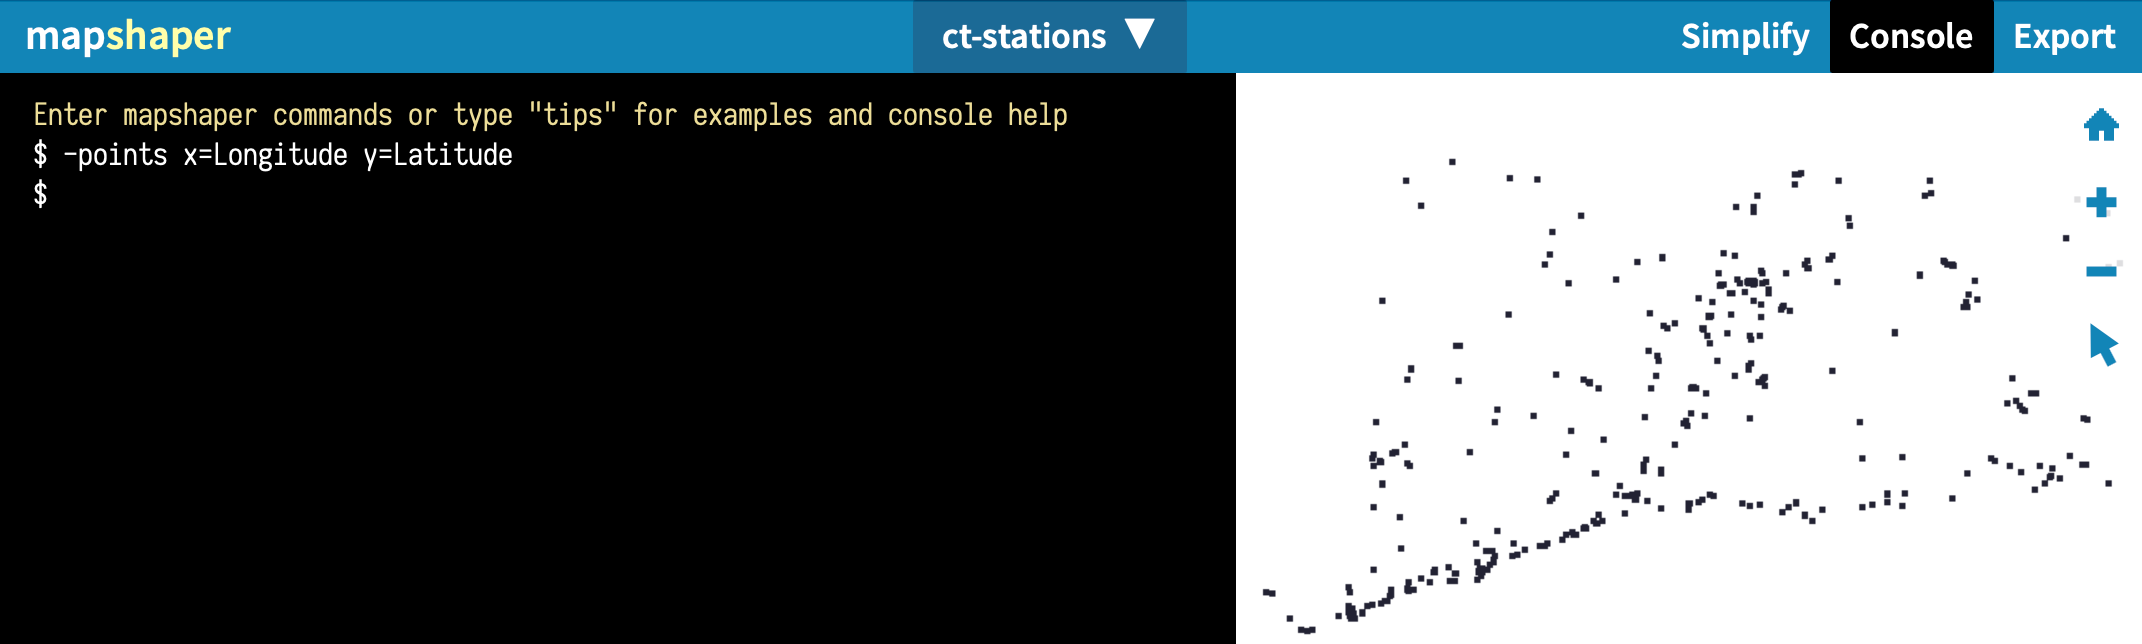
Figure 13.20: Use the Mapshaper -points command to display your CSV data as XY coordinates on a map.
- Import the CT census tracts 2018 GeoJSON data you downloaded above by dragging the file into Mapshaper. Click on the inspect features arrow tool to float over polygons to confirm that they contain data columns named GEOID and NAME, which represent different formats of the census tract name, as shown in Figure 13.21.
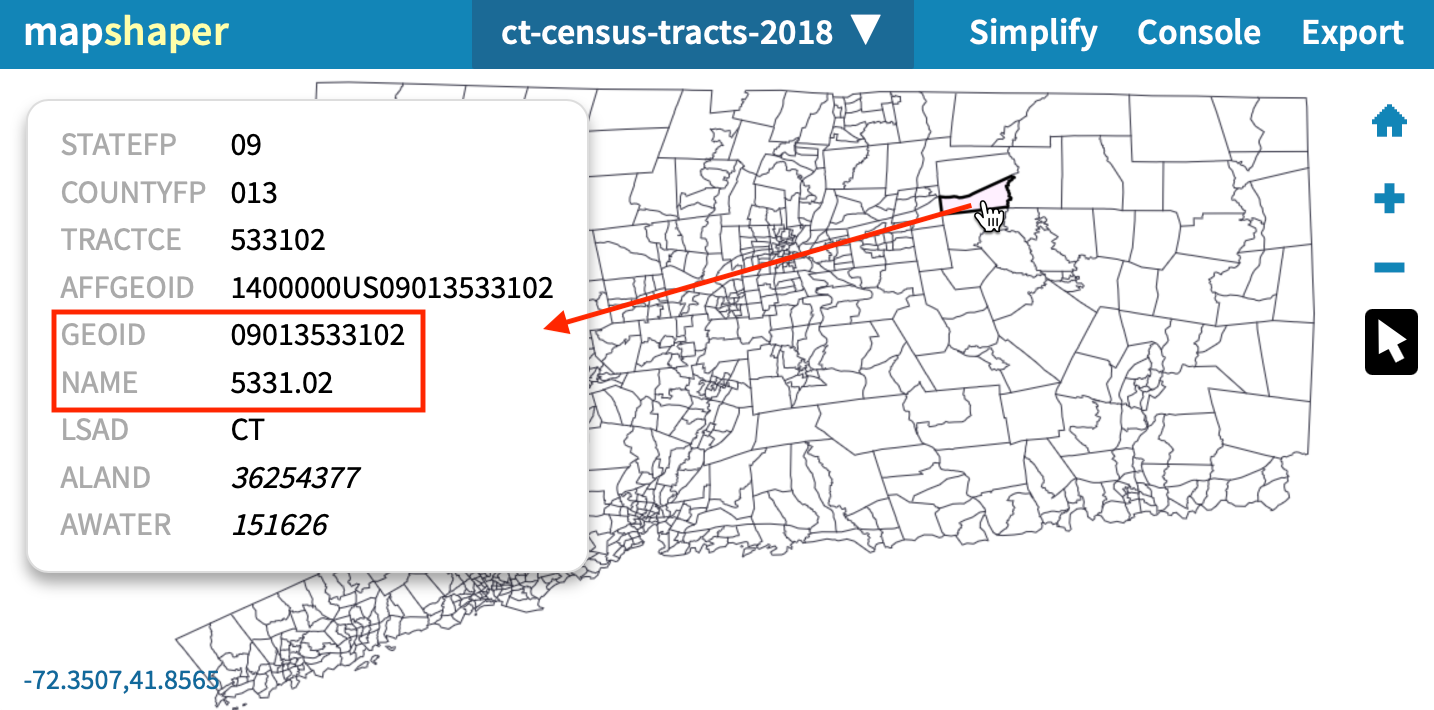
Figure 13.21: Use the inspect features arrow tool to confirm that each tract contains data columns named GEOID and NAME.
- At the top of Mapshaper, click on the dropdown menu to change the active layer back to the points, or in this case ct-stations. Click open the Console and enter the
joincommand in the format below, which matches the polygon layer (ct-census-tracts-2018) to each point, and adds two new data columns (GEOID and NAME) to the CSV, as shown in Figure 13.22.
-join ct-census-tracts-2018 fields='GEOID,NAME'
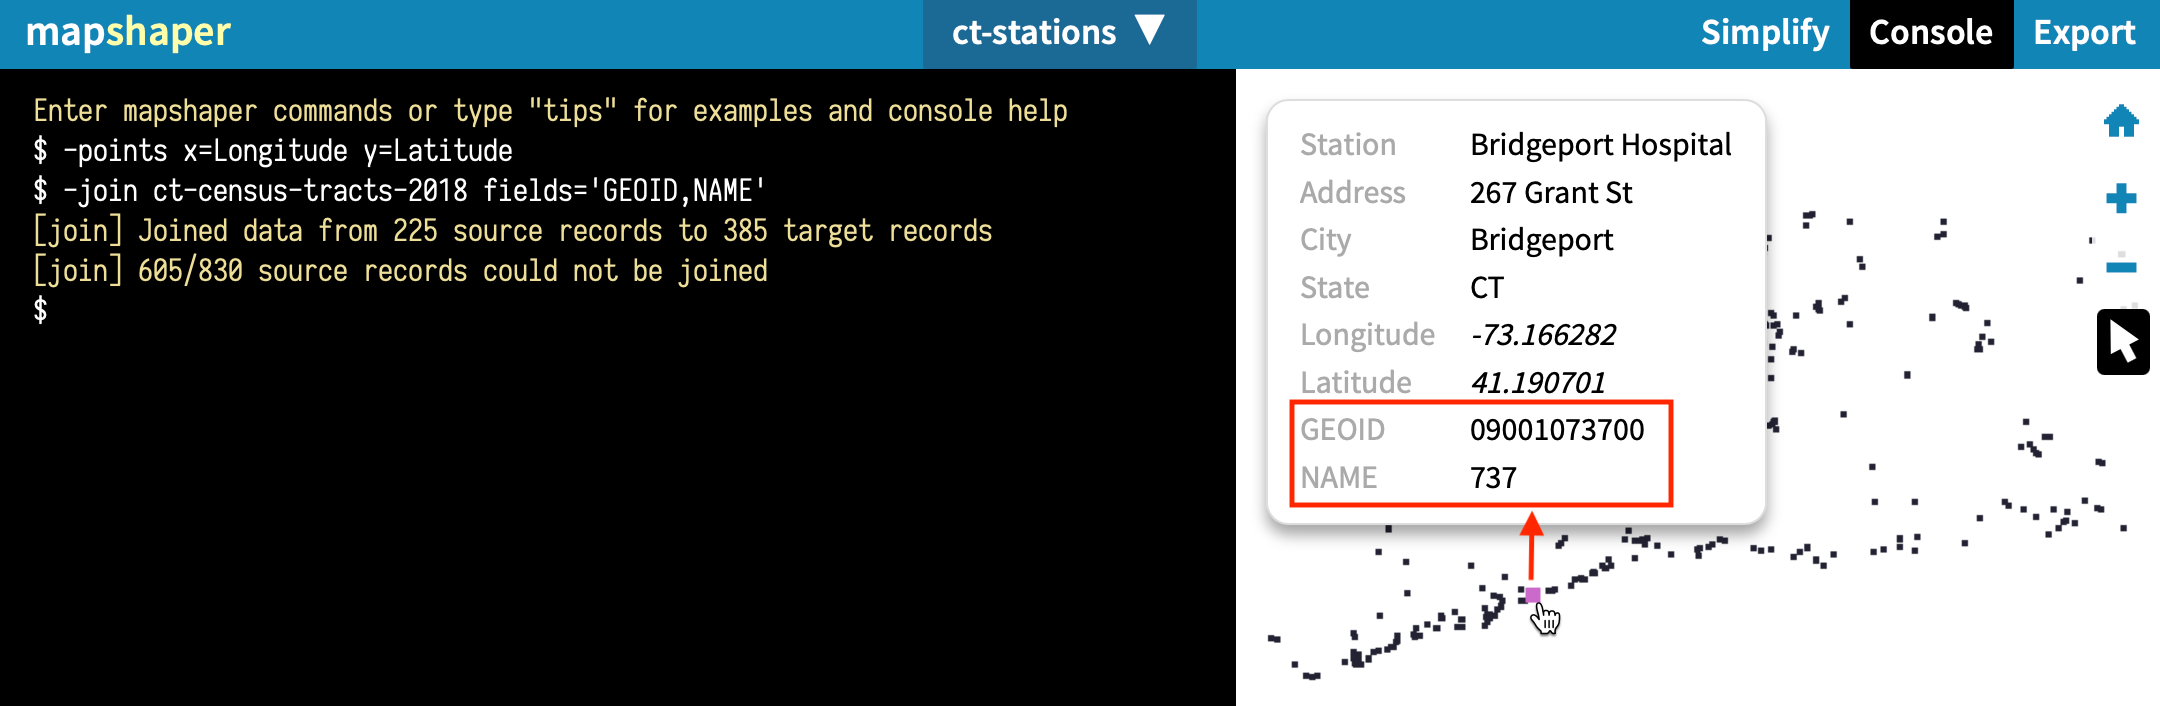
Figure 13.22: Use the inspect features arrow tool to confirm that each tract contains data columns named GEOID and NAME.
Tip: The Mapshaper console also provides helpful information about the status of your join. In this example, joined data from 225 source records (census tracts) to 385 target records (points). But 605 out of 830 source records (census tracts) could not be joined, because they did not match any of the points.
- Export your updated points data (in this case ct-stations) in CSV format to analyze your results in a spreadsheet.
Join spreadsheet data with polygon map
Combining spreadsheet data with geographical boundaries is another common task in data visualization. In this exercise, you will download this Connecticut town boundaries map in GeoJson format, and also download this Connecticut town population data in CSV format, and join the two of them in order to build a choropleth map.
Mapshaper provides a powerful -join command to connect these files. Remember that you need some common keys
in both datasets (such as town name, or state, or country) in order to join the two files. Without a common field, Mapshaper has no way of knowing which
numbers belong to which polygons.
Import both the GeoJSON file and the CSV file you downloaded above into Mapshaper using its Quick import box.
Make sure both files appear in the drop-down list of layers. Your CSV data will appear to resemble a table. Use the Cursor > inspect features tool to make sure the data is imported correctly. If you use the sample Connecticut data, note that the ct-towns layer has name attribute with the name of the town, and ct-towns-popdensity has town names in the town column.
Make your geospatial layer (ct-towns) the active layer.
Open the Console and enter the
-joincommand, like this:
-join ct-towns-popdensity keys=name,town
In this command, ct-towns-popdensity is the CSV layer you are merging with, and keys are the attributes that contain values to join by.
For our sample data, these would be town names which are stored in name attribute of the map file, and town column
of the CSV file.
You will see a message in the console notifying you if join was performed successfully, or if Mapshaper encountered any errors.
Use the Cursor > inspect features tool to make sure you see CSV columns as fields of your polygons, as shown in Figure 13.23.
You can now save the file to your computer by clicking the Export button. Remember to rename an exported GeoJSON file from
.jsonto.geojsonformat.
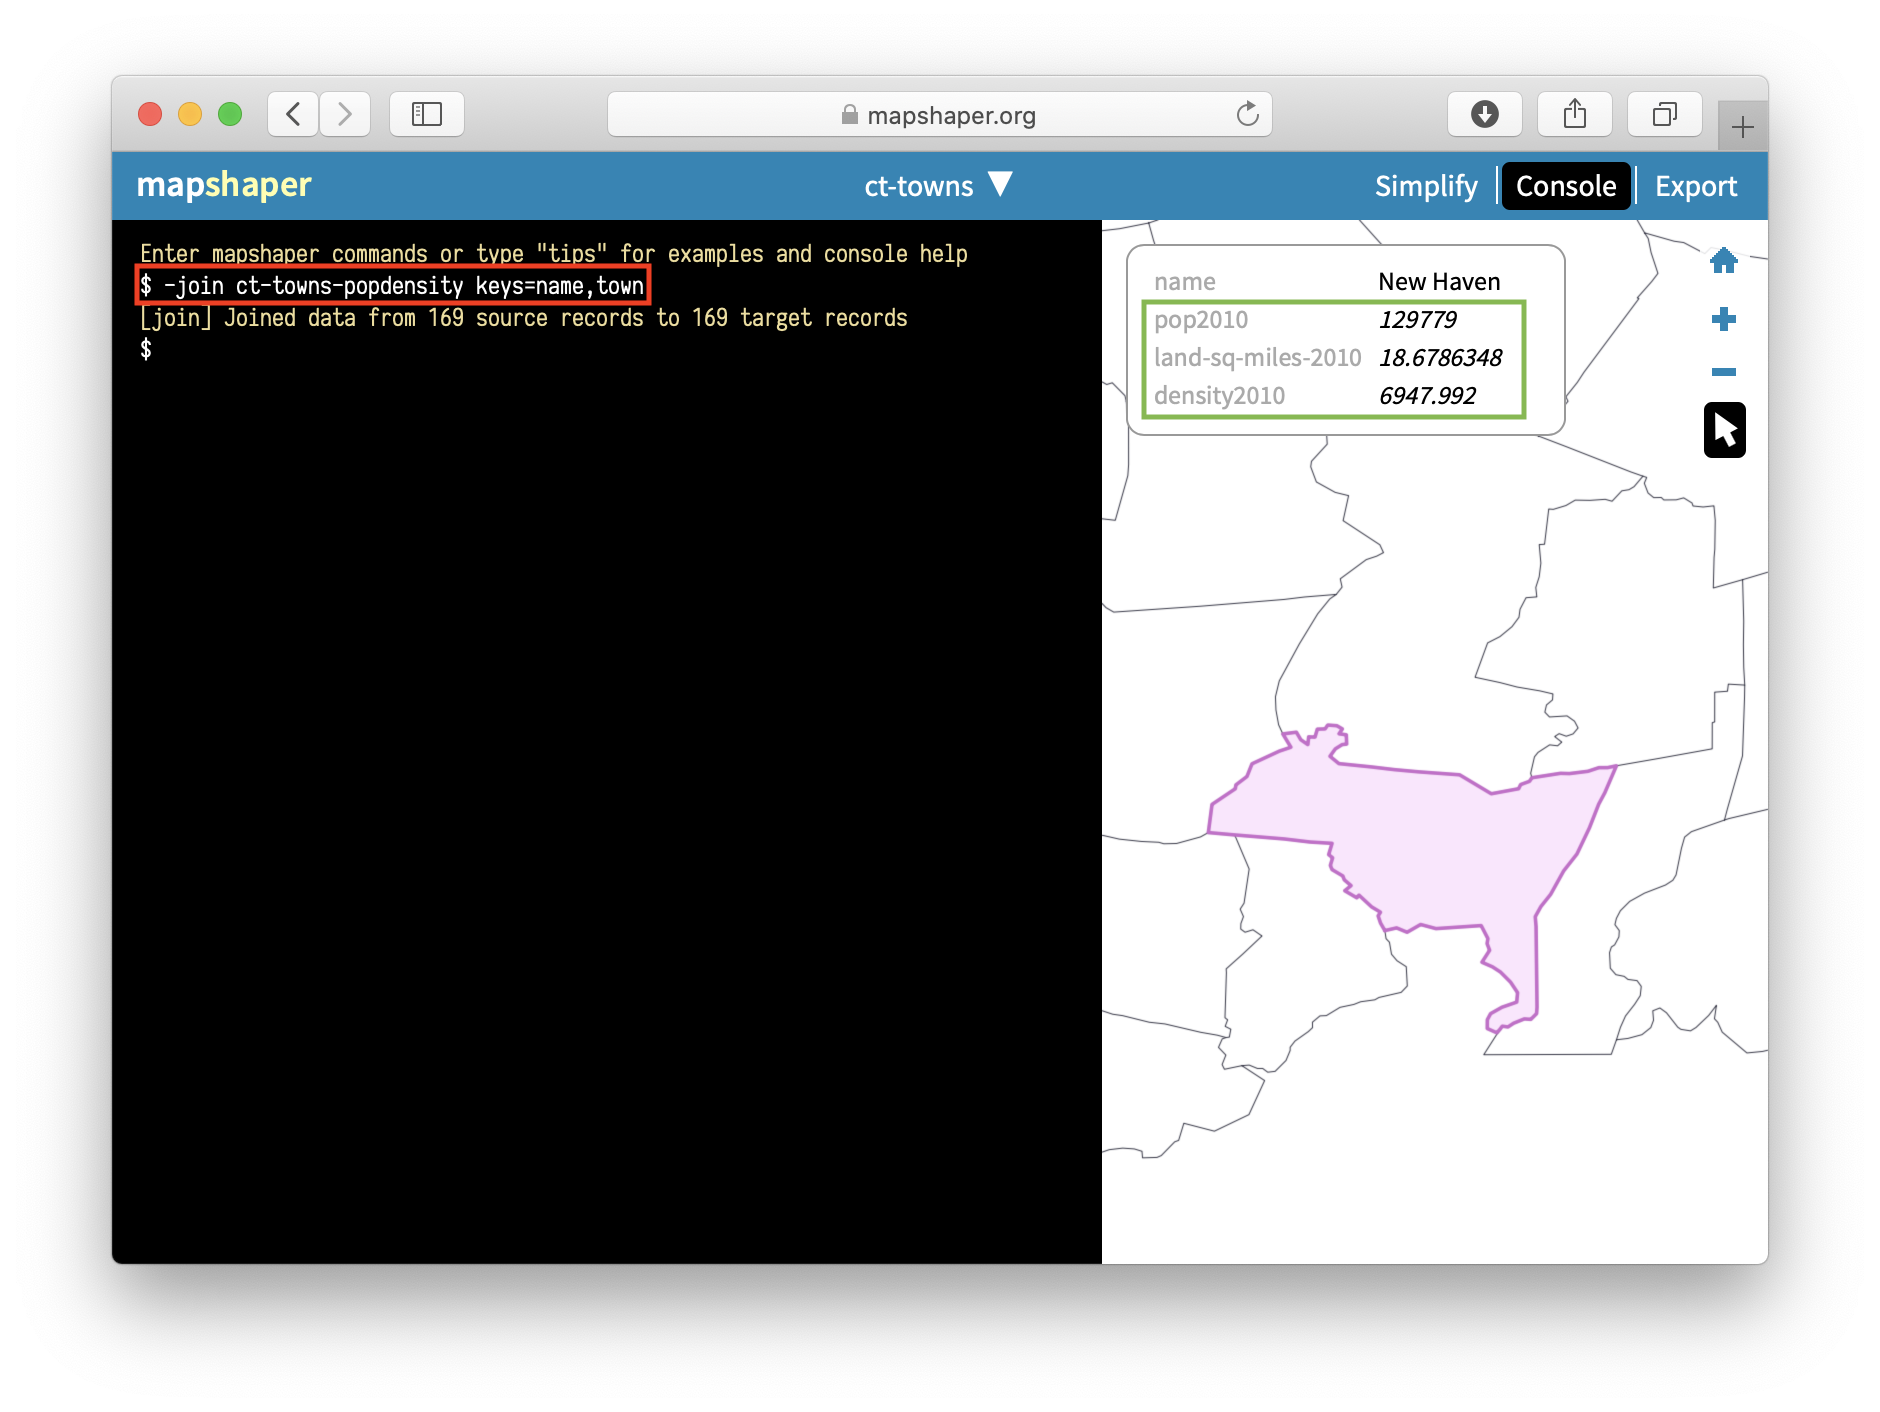
Figure 13.23: In Mapshaper, join spatial and CSV files using common keys, such as town names.
Tip: To avoid confusion, consider using the -rename-fields command on your CSV data that contains key values, in order to match the key attribute name of your map.
In our example, first you would -rename-fields name=town to your CSV file. Renaming this CSV field to name avoids confusion in the second step, because your join command would end with keys=name,name.
Count points in polygons with Mapshaper
Mapshaper lets you count points in polygons, and record that number in polygon attributes using -join command.
Download two sample GeoJSON files to your computer: the points that you want to aggregate, such as hospital points in the US, and polygon boundaries, such as US state boundaries. Import both into Mapshaper.
Make sure you choose “polygons” (not points) for the active layer by selecting it from the dropdown menu.
In the Console, do a
-joincommand using acount()function, like this:
-join hospitals-points calc='hospitals = count()' fields=
This command tells Mapshaper to count points inside the hospitals-points layer and record them as the hospitals attribute of the polygons.
The fields= part tells Mapshaper to not copy any fields from the points, because in our case we are performing many-to-one matching, meaning many hospitals per state.
Use the Cursor > inspect features tool to make sure polygons obtained a new field with the recorded count of points, as shown in Figure 13.24.
Save the new file using the Export button and chose the desired output format. In the section below, we will talk about what happens to objects that don’t join.
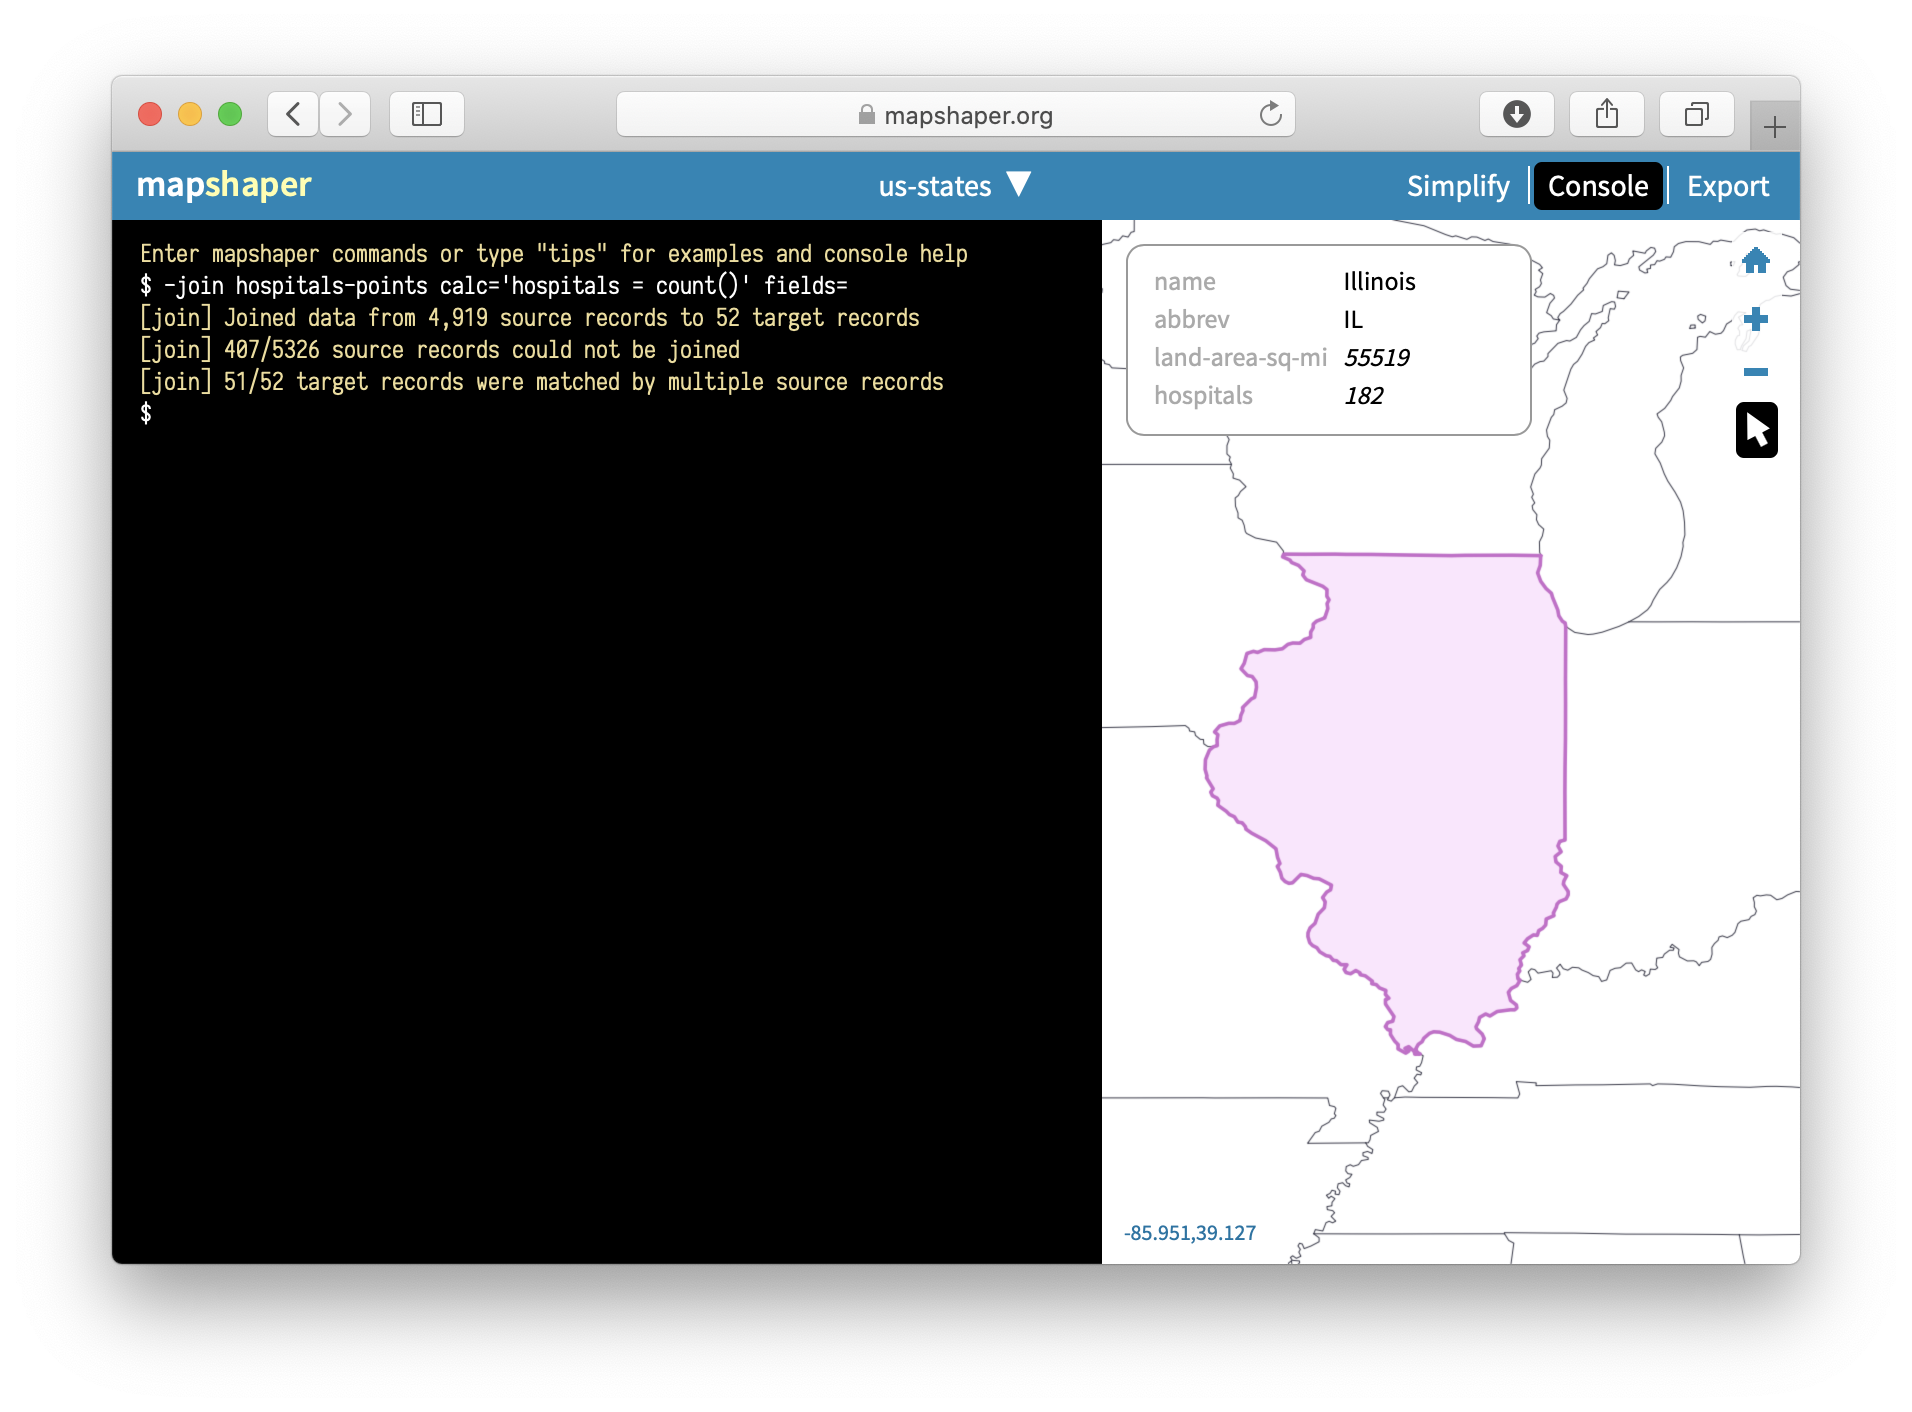
Figure 13.24: Mapshaper’s -join command can count points in polygons.
More about joins
In the section above on “Count points in polygons,” you did not need to specify keys to join locations between two geographical layers: points and polygons. But if one of the files you wish to join is a CSV dataset, you need keys.
If you don’t have a CSV dataset that matches the columns in your boundary map data, you can easily create one. Upload the boundary map to Mapshaper, and export in CSV format. Open the downloaded CSV file in any spreadsheet tool. To match data columns in the CSV spreadsheet, use the XLOOKUP function.
In real life, you will rarely have perfect files with one-to-one matches, so you might want to have more information about which features didn’t get matched so that you can fix your data. Mapshaper helps you keep track of data that is not properly joined or matched. For example, if the polygon map contains 169 features (one for each town in Connecticut), but the CSV table contains only 168 rows of data, Mapshaper will join all of those with matching keys, and then display this message:
[join] Joined data from 168 source records to 168 target records
[join] 1/169 target records received no data
[join] 1/169 source records could not be joined
To get more details on which values were not joined, add unjoined unmatched -info flags to your join command, like this:
-join ct-towns-popdensity keys=name,town unjoined unmatched -info
The unjoined flag saves a copy of each unjoined record from the source table into another layer named unjoined. The unmatched flag saves a copy of each unmatched record from the target table to a new layer named unmatched. Finally, the -info flag outputs some additional information about the joining procedure to the console.
Merge selected polygons with join and dissolve commands
In Mapshaper, you can merge selected polygons into larger clusters using -join and -dissolve commands. Imagine that you are employed by the CT Department of Public Health, and your task is to divide 169 towns into 20 public health districts and produce a new geospatial file.
You should begin by creating a crosswalk of towns and their health districts, which means some way of matching two sets of data, such as zip codes and towns where they are located. In our case, the crosswalk can be as simple as a two-column CSV list of a town and its district, each on a new line. Because your boss didn’t give you a list of towns in a spreadsheet format, but instead a GeoJSON file with town boundaries, let’s extract a list of towns from it.
Import ct-towns.geojson to Mapshaper using Quick import box.
Use the Cursor > inspect features tool to see that each polygon has a name attribute with the name of the town.
Save attribute data as a CSV file using Export button. Open the file in any spreadsheet tool. You will see that your data is a one-column file with a name column that lists 169 towns.
In your spreadsheet, create a second column titled merged and copy-paste values from the first name column. At this point your spreadsheet contains two columns with the same values.
Pick a few towns, such as West Hartford and Bloomfield, and assign “Bloomfield-West Hartford” to their merged column, as shown in Figure 13.25. You can stop here and move to the next step, or keep assigning district names to a few other neighboring towns.
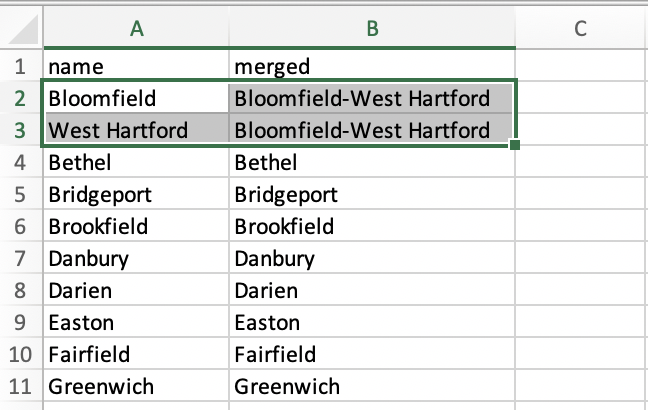
Figure 13.25: Create a two-column crosswalk of town names and their merged health districts.
Save this new spreadsheet file as ct-towns-merged.csv, and drag-and-drop it to Mapshaper on top of your ct-towns layer. Click Import.
In Mapshaper, this new CSV layer, named ct-towns-merged, will appear as a series of table cells. From the dropdown menu, select ct-towns to get back to your map.
Now you are ready to merge certain towns into districts according to your uploaded CSV file. Open the Console, and type:
-join ct-towns-merged keys=name,name
to join the CSV layer with the boundaries layer that you see on the screen.
Then type:
-dissolve merged
to dissolve polygons of towns according to the merged column of the CSV file.
In our example, only Bloomfield and West Hartford are dissolved into a combined “Bloomfield-West Hartford” regional health district, with the shared boundary line between those towns becoming grayed out, and all of the other polygons remain the same. Figure 13.26 shows the final result.
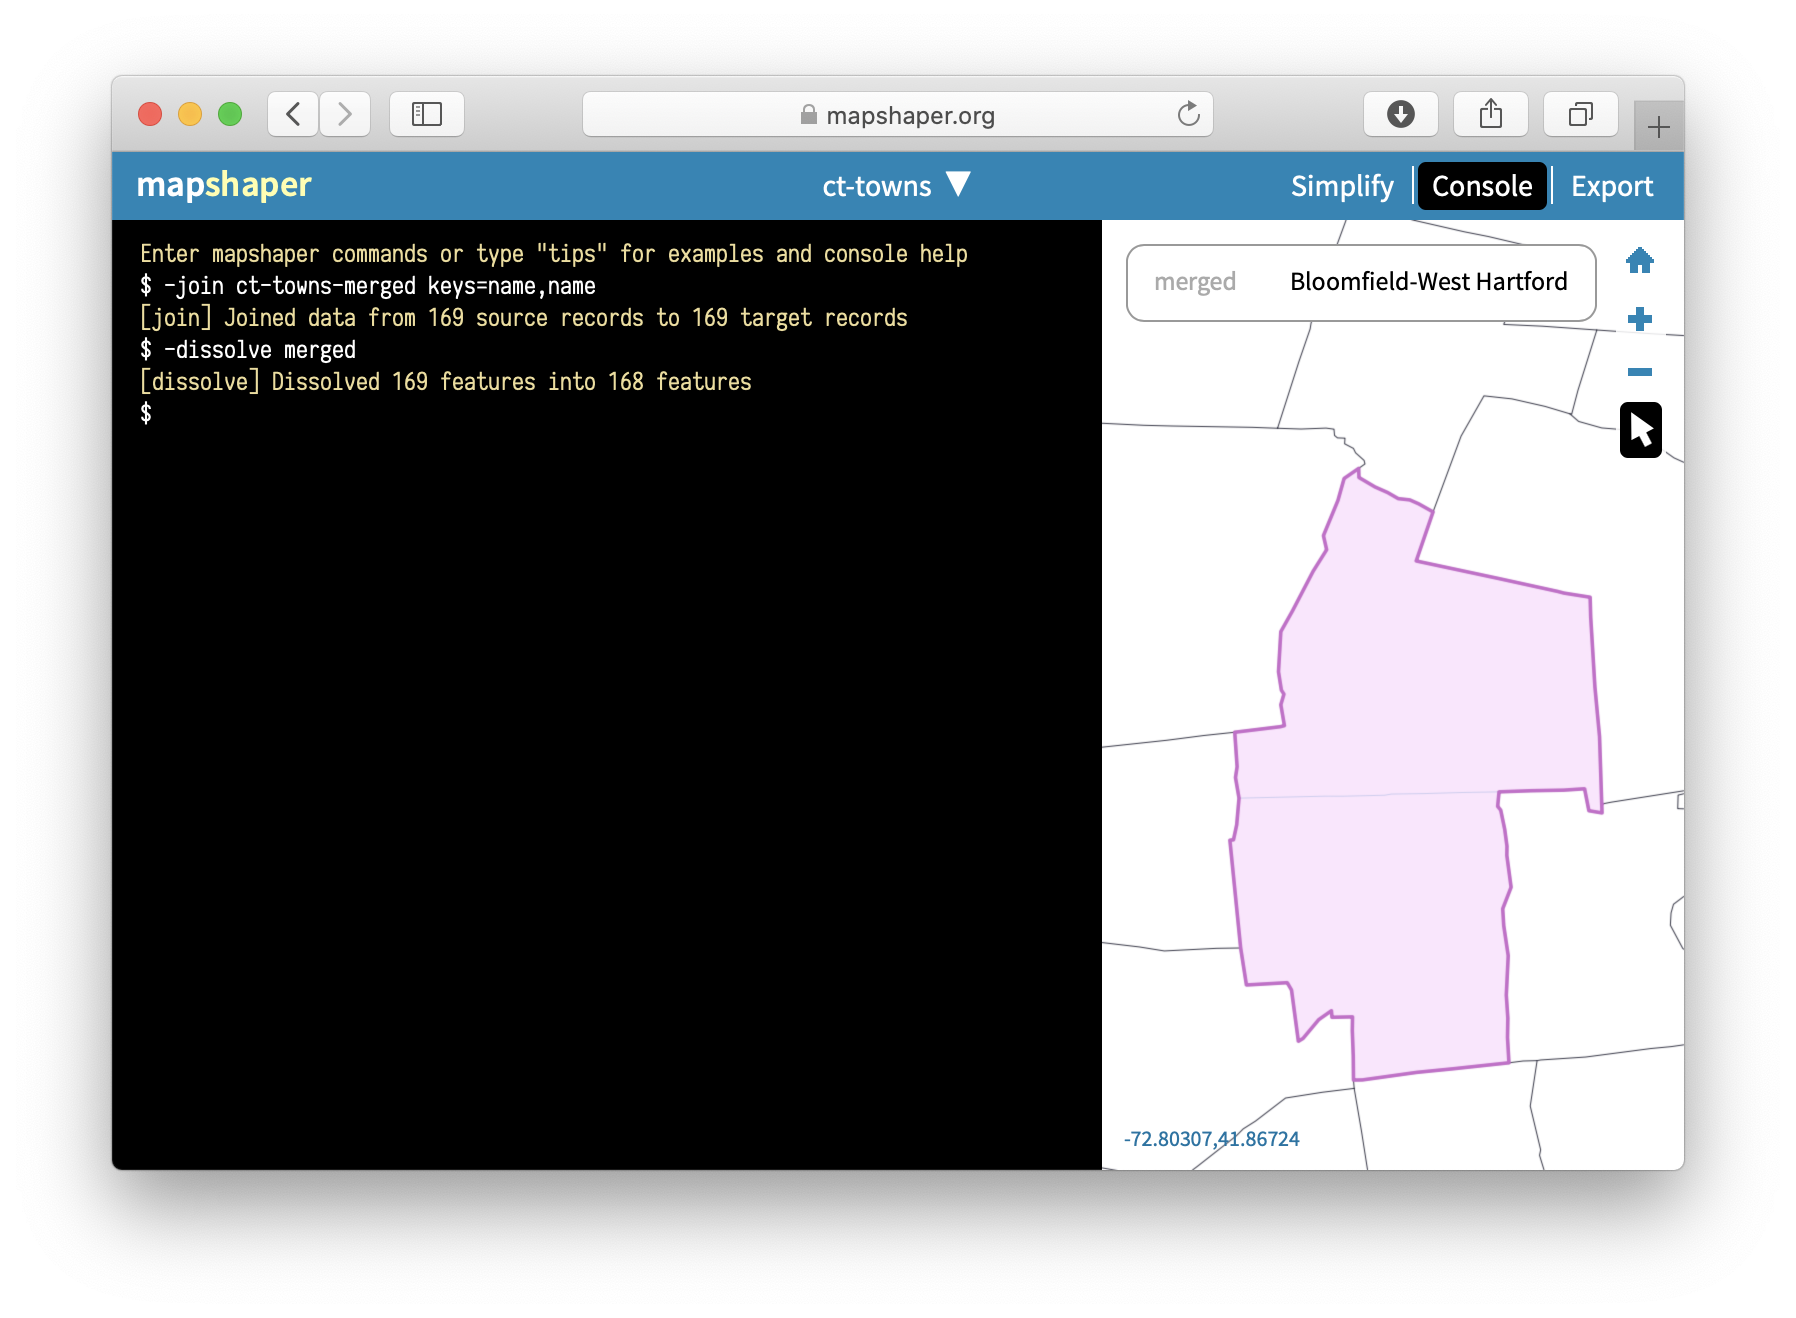
Figure 13.26: Merge polygons based on a predefined crosswalk.
You can inspect attribute data of polygons using Cursor > inspect features tool, and save the resulting file
using the Export button. Remember to rename an exported GeoJSON file from .json to .geojson format.
Overall, Mapshaper is a powerful geodata editing tool with many more commands that are worth exploring. Some of these include changing projections, filtering features using JavaScript expressions, assigning colors to polygons based on values, and many more. Explore the MapShaper Wiki on GitHub to learn more commands and see more examples.