#StandWithUkraine - Stop the Russian invasion
Join us and donate. Since 2022 we have contributed over $5,000 in book royalties to Save Life in Ukraine & Ukraine Humanitarian Appeal & The HALO Trust, and we will continue to give!
Chapter 2 Strengthen Your Spreadsheet Skills
Before we begin to design data visualizations, it’s important to make sure our spreadsheet skills are up to speed. While teaching this topic, we’ve heard many people describe how they “never really learned” how to use spreadsheet tools as part of their official schooling or workplace training. But spreadsheet skills are vital to learn, not only as incredible time-savers for tedious tasks, but more importantly, to help us discover the stories buried inside our data.
The interactive charts and maps that we’ll construct later this book are built on data tables, which we typically open with spreadsheet tools, such as Google Sheets, LibreOffice, or Microsoft Excel. Spreadsheets typically contain columns and rows of numerical or textual data, as shown in Figure 2.1. The first row often contains headers, meaning labels describing the data in each column. Also, columns are automatically labeled with letters, and rows with numbers, so that every cell or box in the grid can be referenced, such C2. When you click on a cell, it may display a formula that automatically runs a calculation with references other cells. Formulas always begin with an equal sign, and may simply add up other cells (such as =C2+C3+C4), or may contain a function that performs a specific operation (such as calculating the average of a range of cells: =average(C2:C7)). Some spreadsheet files contain multiple sheets (sometimes called workbooks), where each tab across the bottom opens a specific sheet.
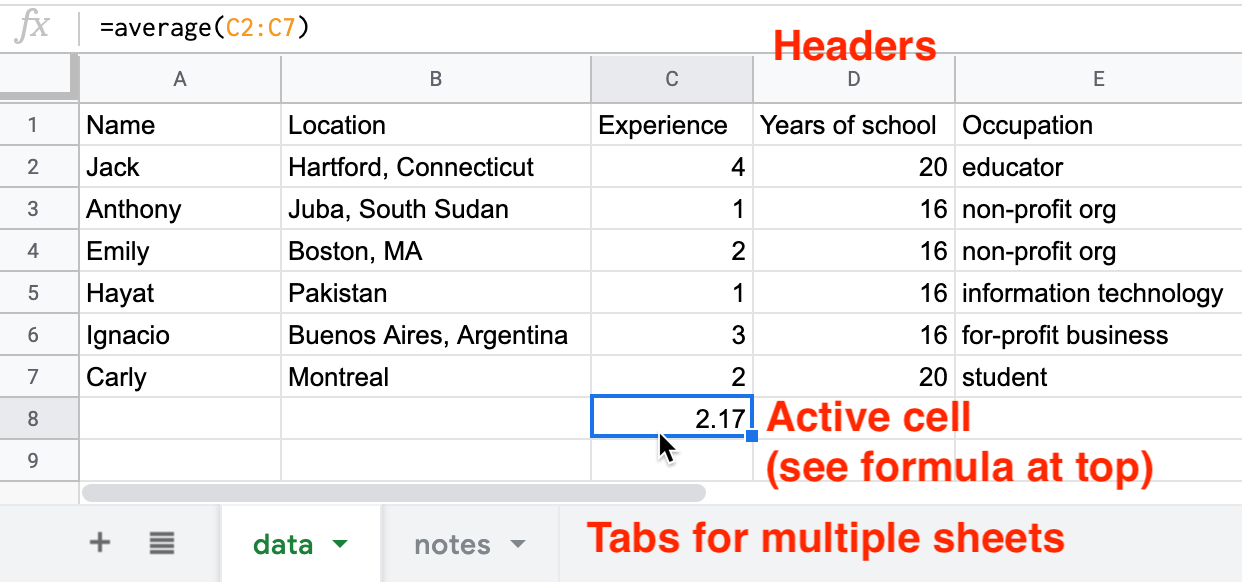
Figure 2.1: Screenshot of a typical spreadsheet, with headers, tabs, and the active cell displaying a formula.
In this chapter, we’ll start by reviewing basic steps, such as sharing, uploading, geocoding with add-on tools, and collecting data with online forms. Then we’ll move on to ways of organizing and analyzing your data, such as sorting and filtering, calculating with formulas, and summarizing with pivot tables. Finally, we’ll examine ways to connect different sheets, such as matching columns with lookup tables, and relational databases. We illustrate all of these methods with beginner-level users in mind, meaning they do not require any prior background.
We’ll practice several of these skills using sample data that may interest you, because it includes people like you. So far over 3,000 readers of this book have responded to a quick public survey about their general location, prior level of experience and education, and goals for learning data visualization. If you haven’t already done so, fill out the quick survey form to contribute your own response, and also to give you a better sense of how the questions were posed, then see the results in the public sample dataset.
If you want to learn ways to make your computer do more of the tedious data preparation work for you, this chapter is definitely for you. Or if you already feel very familiar with spreadsheets, you should at least skim this chapter, and perhaps you’ll learn a trick or two that will help you to create charts and maps more efficiently later in the book.