#StandWithUkraine - Stop the Russian invasion
Join us and donate. Since 2022 we have contributed over $5,000 in book royalties to Save Life in Ukraine & Ukraine Humanitarian Appeal & The HALO Trust, and we will continue to give!
Guiding Questions for Your Search
For many people, a data search is simply googling some keywords on the web. Sometimes that works, sometimes not. When that approach flounders, we reflect on the many lessons we’ve learned about data-hunting while working alongside talented librarians, journalists, and researchers. Collectively, they taught us a set of guiding questions that outline a more thoughtful process about how to search for data:
What exactly is the question you’re seeking to answer with data?
Literally write it down—in the form of a question, punctuated with a question mark at the end—to clarify your own thinking, and also so that you can clearly communicate it to others who can assist you. All too often, our brains automatically leap ahead to try to identify the answer, without reflecting on the best way frame the question in a way that does not limit the range of possible outcomes.
Look back at data visualization projects that made a lasting impression on you to identify the underlying question that motivated them. In their coverage of the US opioid epidemic, the Washington Post and the West Virginia Charleston Gazette-Mail successfully fought a legal battle to obtain a US Drug Enforcement Agency database that the federal government and the drug industry sought to keep secret. In 2019, a team of data journalists published the database with interactive maps to answer one of their central questions: How many prescription opioid pills were sent to each US county, per capita, and which companies and distributors were responsible? Their maps revealed high clusters in several rural Appalachian counties that received over 150 opioid pills per resident, on average, each year from 2006 to 2014. Moreover, only six companies distributed over three-quarters of the 100 billion oxycodone and hydrocodone pills across the US during this period: McKesson Corp., Walgreens, Cardinal Health, AmerisourceBergen, CVS and Walmart.10 Even if you’re not working with data as large or as controversial as this one, the broader lesson is to clearly identify the question you’re seeking to answer.
Also, it’s perfectly normal to revise your question as your research evolves. For example, Jack and his students once began a data project by naively asking What were Connecticut public school test scores in the 1960s? Soon we discovered that standardized state-level school testing as we know it today did not appear in states like Connecticut until the mid-1980s school accountability movement. Even then, results were not widely visible to the public until newspapers began to publish them once a year in print in the 1990s. Later, real estate firms, school-ratings companies, and government agencies began to publish data continuously on the web as the Internet expanded in the late 1990s and early 2000s. Based on what we learned, we revised our research question to When and how did Connecticut homebuyers start to become aware of school test scores, and how did these influence the prices they were willing to pay for access to selected public school attendance areas?11 Be prepared to refine your question when the evidence leads you in a better direction.
What types of organizations may have collected or published the data you seek?
If a governmental organization may have been involved, then at what level: local, regional, state/provincial, national, or international? Which branch of government: executive, legislative, judicial? Or which particular governmental agency might have been responsible for compiling or distributing this information? Since all of these different structures can be overwhelming, reach out to librarians who are trained to work with government documents and databases, often at state government libraries, or at local institutions participating in the US Federal Depository Library Program. Or might the data you seek have been compiled by a non-governmental organization, such as academic institutions, journalists, non-profit groups, or for-profit corporations? Figuring out which organizations might have collected and published the data can help point you to the digital or print materials they typically publish, and most appropriate tools to focus your search in that particular area.
What level(s) of data are available?
Is information disaggregated into individual cases or aggregated into larger groups? Smaller units of data allow you to make more granular interpretations, while larger units can help you to identify broader patterns. Librarians can help us to decipher how and why organizations publish data at different levels. For example, the US Census collects data every ten years about each person residing in the nation. Under law, individual-level data about each person is confidential for 72 years, then released to the public. Currently, you can search for specific individuals in the 1940 Census and earlier decades at the US National Archives and other websites, as shown in Figure 3.1.
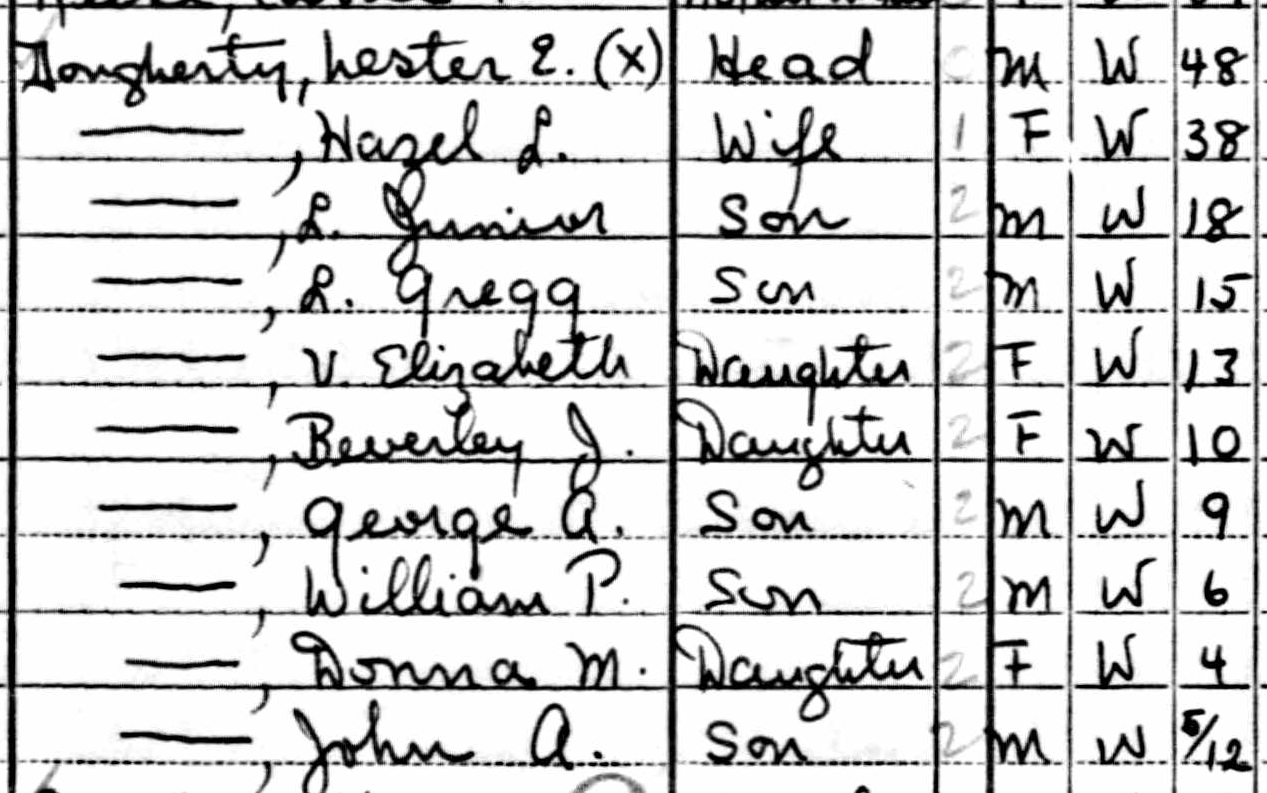
Figure 3.1: Excerpt of individual-level 1940 US Census data for Jack’s father’s family.
Meanwhile, the US Census publishes data for current years by aggregating individual records into larger geographic areas to protect people’s privacy. Using the Standard Hierarchy of US Census Geographic Entities, we created a simplified map in Figure 3.2 to show the relationships between some of the most common geographic areas for Hartford, Connecticut:
- State
- County
- County subdivisions (equivalent to Connecticut towns and cities)
- Census tracts (designated areas, roughly 1,200–8,000 people)
- Block groups (sub-unit of tracts, roughly 600–3,000 people)
- Census blocks (sub-unit of block groups, but not always a city block)12
Figure 3.2: Common US census geographies around Hartford, Connecticut, 2019. Zoom out in the interactive version for county and state boundaries.
Have prior publications drawn on similar data, and if so, how can we trace their sources?
Some of our best ideas began when reading an article or book that described its source of evidence, and we imagined new ways to visualize that data. Several times we have stumbled across a data table in a print publication, or perhaps an old web page, which sparked our interest in tracking down a newer version to explore. Even outdated data helps by demonstrating how someone previously collected it at one point in time. Follow the footnotes to track down its origins. Use Google Scholar and more specialized research databases (ask librarians for assistance if needed) to track down the source of previously-published data. One bonus is that if you can locate more current data, you may be able to design a visualization that compares change over time.
What if no one has collected the data you’re looking for?
Sometimes this happens due to more than a simple oversight. In Data Feminism, Catherine D’Ignazio and Lauren Klein underscore how issues of data collection “are directly connected to larger issues of power and privilege” by recounting a story about tennis star Serena Williams. When Williams experienced life-threatening complications while giving birth to her daughter in 2017, she called public attention to the way that she, a Black woman, needed to advocate for herself in the hospital. After her experience, she wrote on social media that “Black women are over 3 times more likely than white women to die from pregnancy- or childbirth-related causes,” citing the US Centers for Disease Control and Prevention (CDC). When journalists followed up to investigate further, they discovered the absence of detailed data on maternal mortality, and what a 2014 United Nations report described as a “particularly weak” aspect of data collection in the US healthcare system. Journalists reported that “there was still no national system for tracking complications sustained in pregnancy and childbirth,” despite comparable systems for other health issues such as heart attacks or hip replacements. Power structures are designed to count people whose lives are highly valued, or under a high degree of surveillance. D’Ignazio and Klein call on us to critically examine these power systems, collect data to counter their effects, and make everyone’s labor in this process more visible.13 If no one has collected the data you’re looking for, perhaps you can make valuable steps to publicly recognize the issue, and possibly gather it yourself.
Hunting for data involves much more than googling keywords. Deepen your search by reflecting on the types of questions that librarians, journalists, and other researchers have taught us to ask: What types of organizations might—or might not—have collected the data? At what levels? At any prior point in time? And under what social and political contexts? In the next section, you’ll learn more about related issues to consider over public and private data.
“Drilling into the DEA’s Pain Pill Database” (Washington Post, July 16, 2019), https://www.washingtonpost.com/graphics/2019/investigations/dea-pain-pill-database/.↩︎
Jack Dougherty et al., “School Choice in Suburbia: Test Scores, Race, and Housing Markets,” American Journal of Education 115, no. 4 (August 2009): 523–48, http://digitalrepository.trincoll.edu/cssp_papers/1.↩︎
Katy Rossiter, “What Are Census Blocks?” (US Census Bureau, July 11, 2011), https://www.census.gov/newsroom/blogs/random-samplings/2011/07/what-are-census-blocks.html.↩︎
D’Ignazio and Klein, Data Feminism, chap. 1.↩︎