#StandWithUkraine - Stop the Russian invasion
Join us and donate. Since 2022 we have contributed over $5,000 in book royalties to Save Life in Ukraine & Ukraine Humanitarian Appeal & The HALO Trust, and we will continue to give!
Get the Embed Code or iframe Tag
In this section, you’ll learn how to copy the embed code or iframe tag that is automatically generated when you publish a chart or map on different visualization platforms featured in this book. Remember that embed codes contain the essential iframe tag, along with other bits of code to display the chart or map from the primary site and make it appear seamlessly on the secondary site.
We’ll break this down into three steps for each visualization platform. First, we will demonstrate how to copy your embed code or iframe tag from Google Sheets, Datawrapper, Tableau Public, and other platforms listed below. Second, we’ll show you how to test the embed code or iframe tag in a wonderful assistant called the W3Schools TryIt iframe page, as shown in Figure 9.3. It’s a great way to see what happens if you need to trim parts of the embed code before placing it in web page, and test if it still works. Third, we’ll point you to the next section to learn how to properly paste the embed code in your preferred website, including common platforms such as WordPress, SquareSpace, Wix, and Weebly.
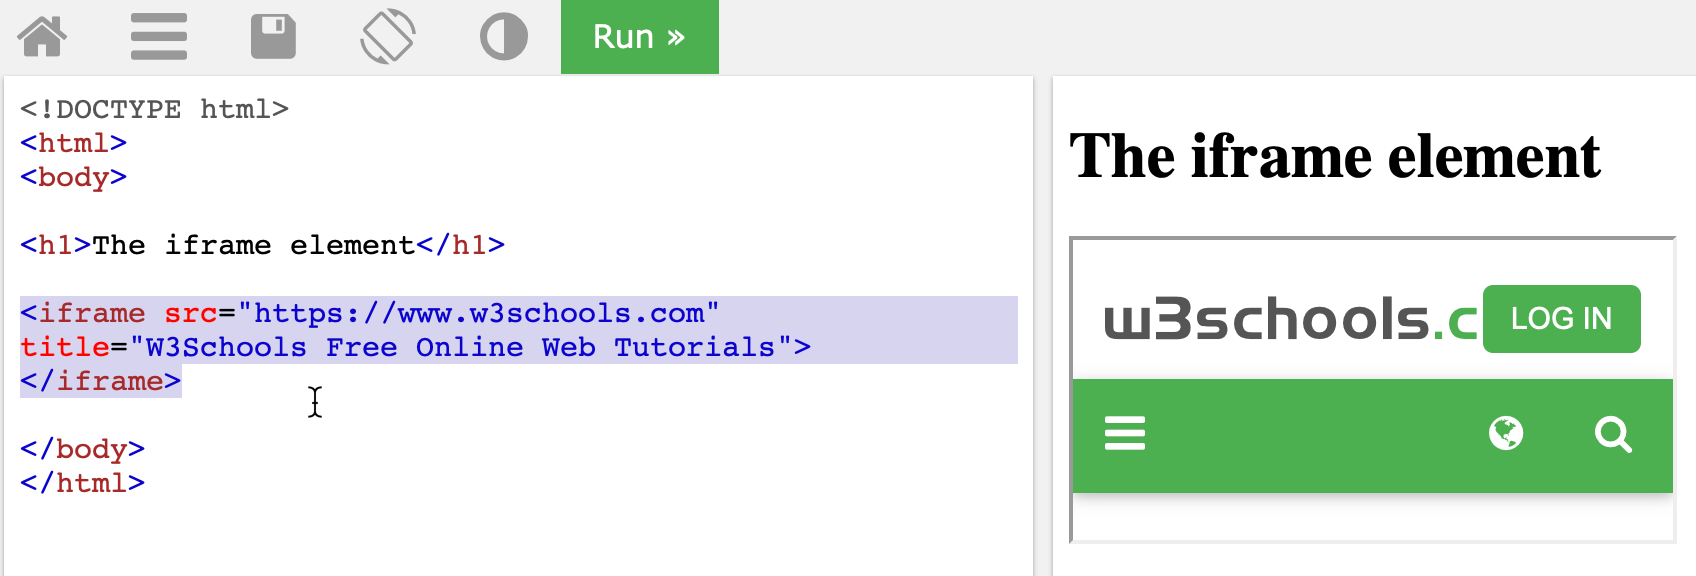
Figure 9.3: For each embed code below, paste it in place of the selected text of the W3Schools TryIt iframe page to test how it works.
from Google Sheets
- After you create a Google Sheets chart as you did in Chapter 6, click the three-dot kebab menu in the upper-right corner of the chart to publish it, as shown in Figure 9.4.
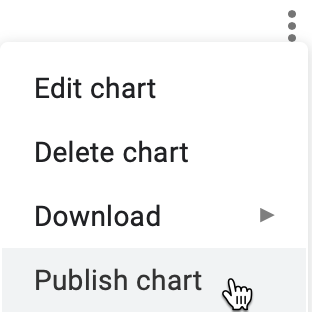
Figure 9.4: In your chart, click the three-dot kebab menu to publish it.
- In the next screen, select the Embed tab and Interactive chart, and click the Publish button to share it online. Select and copy the embed code, as shown in Figure 9.5.
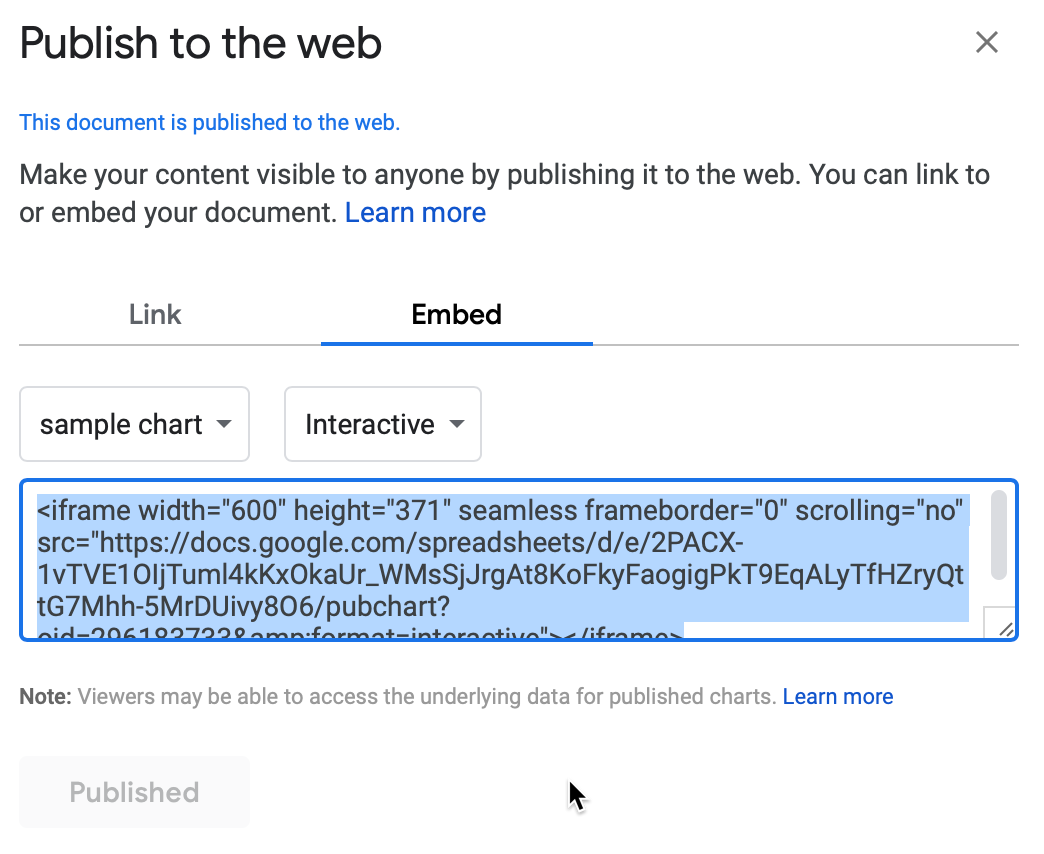
Figure 9.5: Click Embed and Interactive and Publish, then select and copy the embed code.
- To better understand how the embed code works, open the W3Schools TryIt iframe page. Select the current iframe tag, paste in your embed code to replace it, and press the green Run button. The result should be similar to Figure 9.6, but instead will display your embed code and interactive visualization.
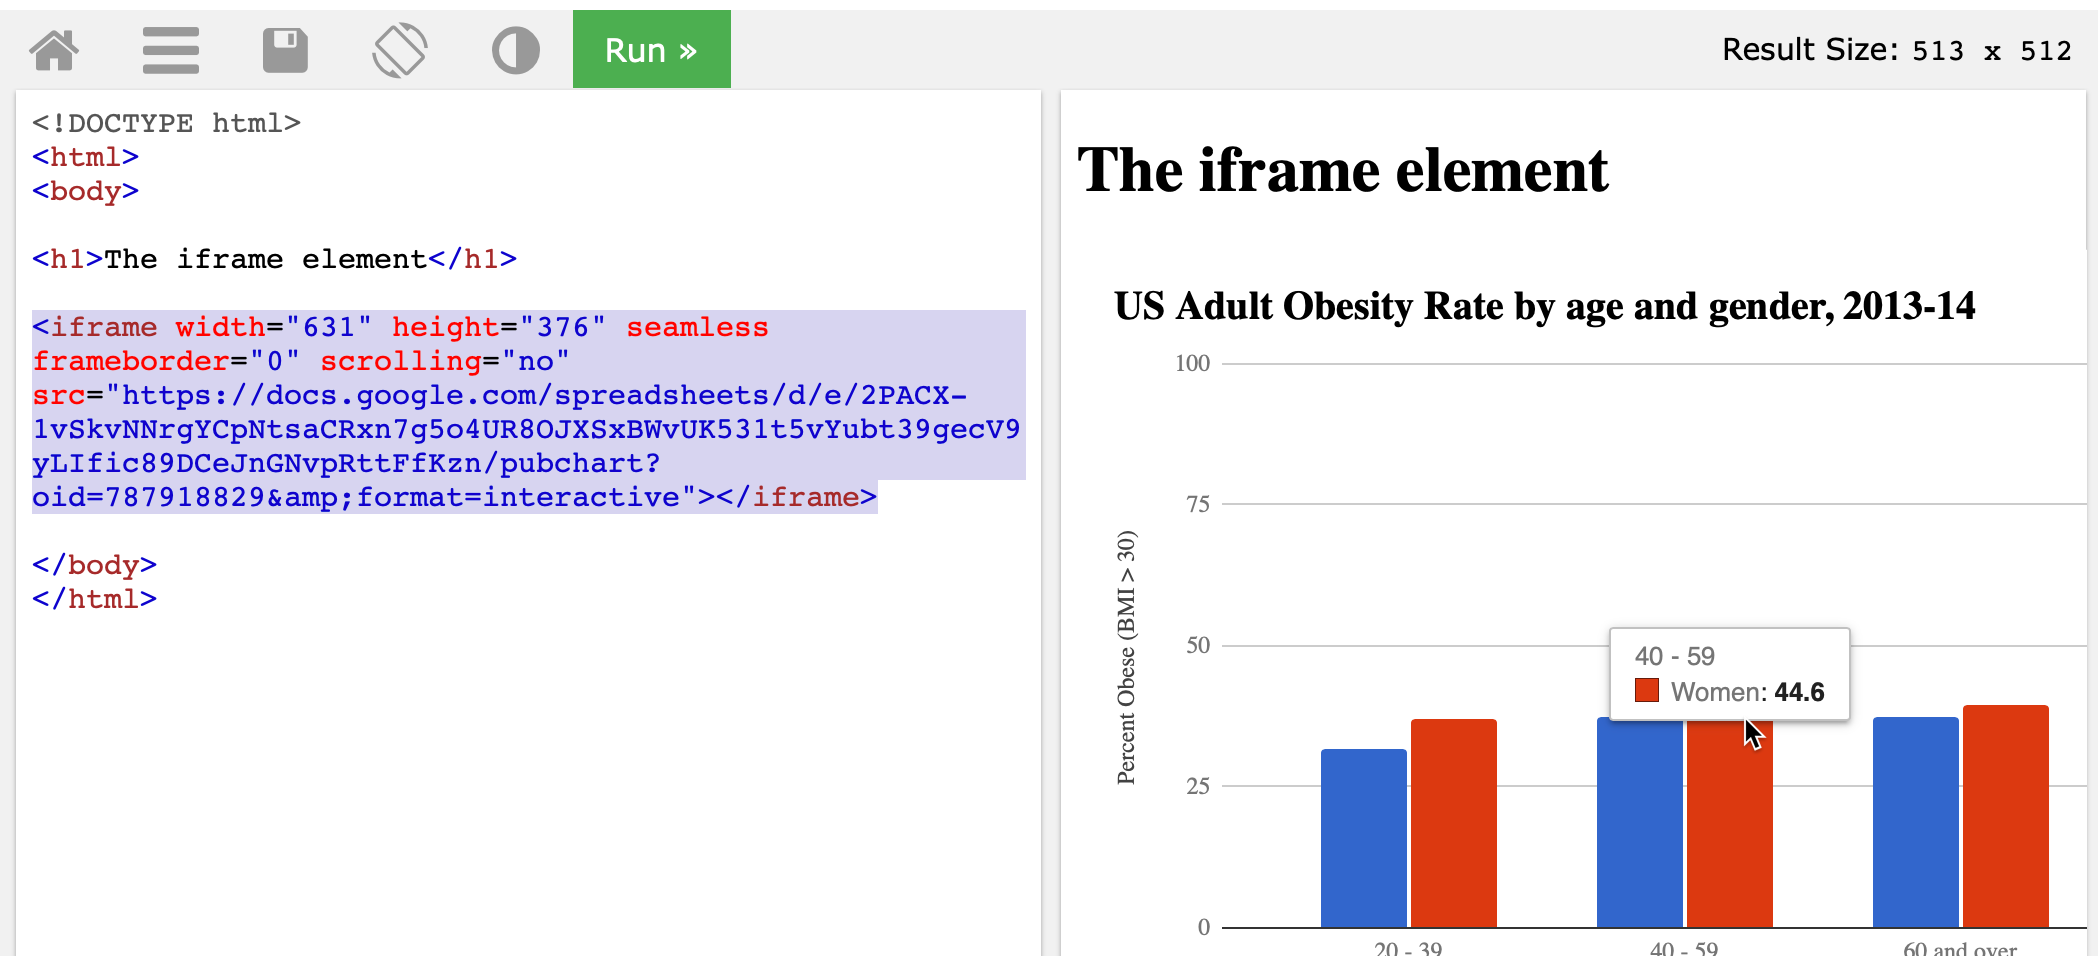
Figure 9.6: Paste your Google Sheets embed code to place of the current iframe tag in the TryIt page and click Run.
At first glance, the Google Sheets embed code may appear long, but it’s actually a straightforward iframe tag with a long source link. Look closely and you’ll see iframe settings such as width and height (measured here in pixels), and frameborder='0' and scrolling='no' to improve its appearance.
- Now jump to the paste code to website section of this chapter to learn how to properly insert your embed code into your preferred platform.
from Datawrapper
- After you create a Datawrapper chart as you did in Chapter 6 or map as you did in Chapter 7 or interactive table as you did Chapter 8, proceed to the final screen and click the Publish button, as shown in Figure 9.7. This publishes the interactive version of your chart or map online. Further down on the same screen you can also export a static image, if desired.
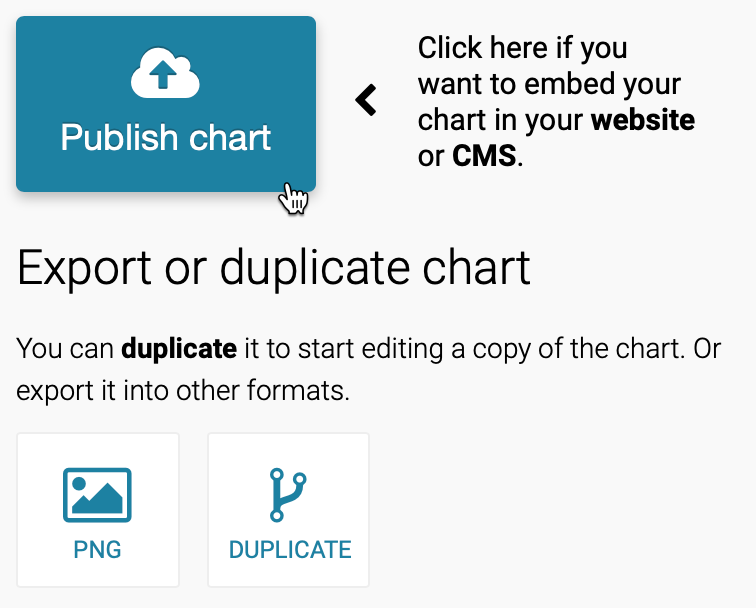
Figure 9.7: Proceed to the final screen and click the Publish button.
- On the next screen, click copy to get the Datawrapper embed code, as shown in Figure 9.8. The default responsive iframe version of the embed code contains additional instructions to improve its appearance on both small and large device screens.
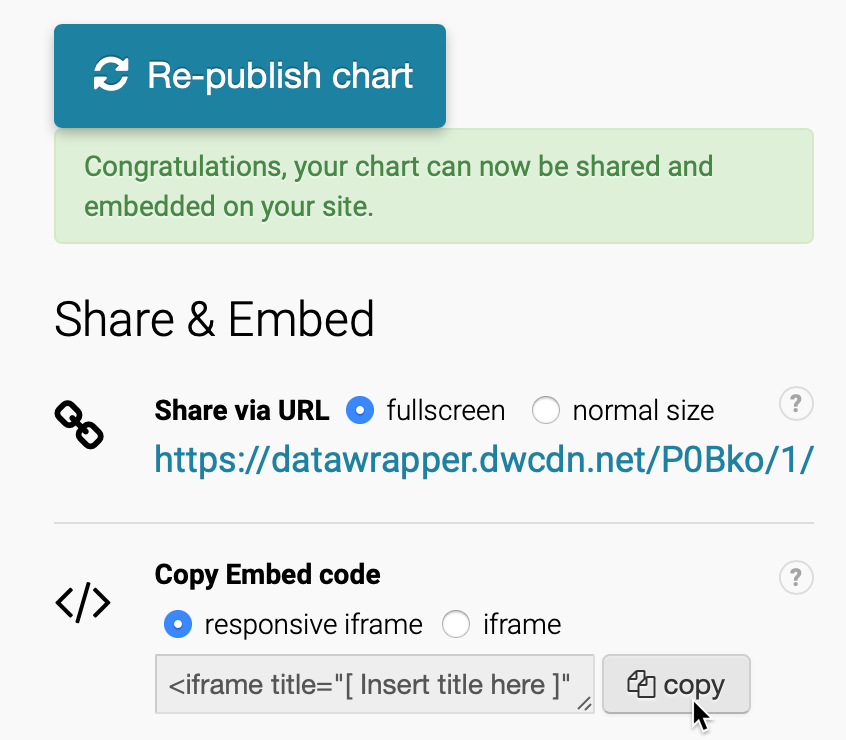
Figure 9.8: Copy the responsive iframe version of the Datawrapper embed code.
- To better understand how the embed code works, open the W3Schools TryIt iframe page. Select the current iframe tag, paste in your embed code to replace it, and press the green Run button. The result should be similar to Figure 9.9, but instead will display your unique embed code and interactive visualization.
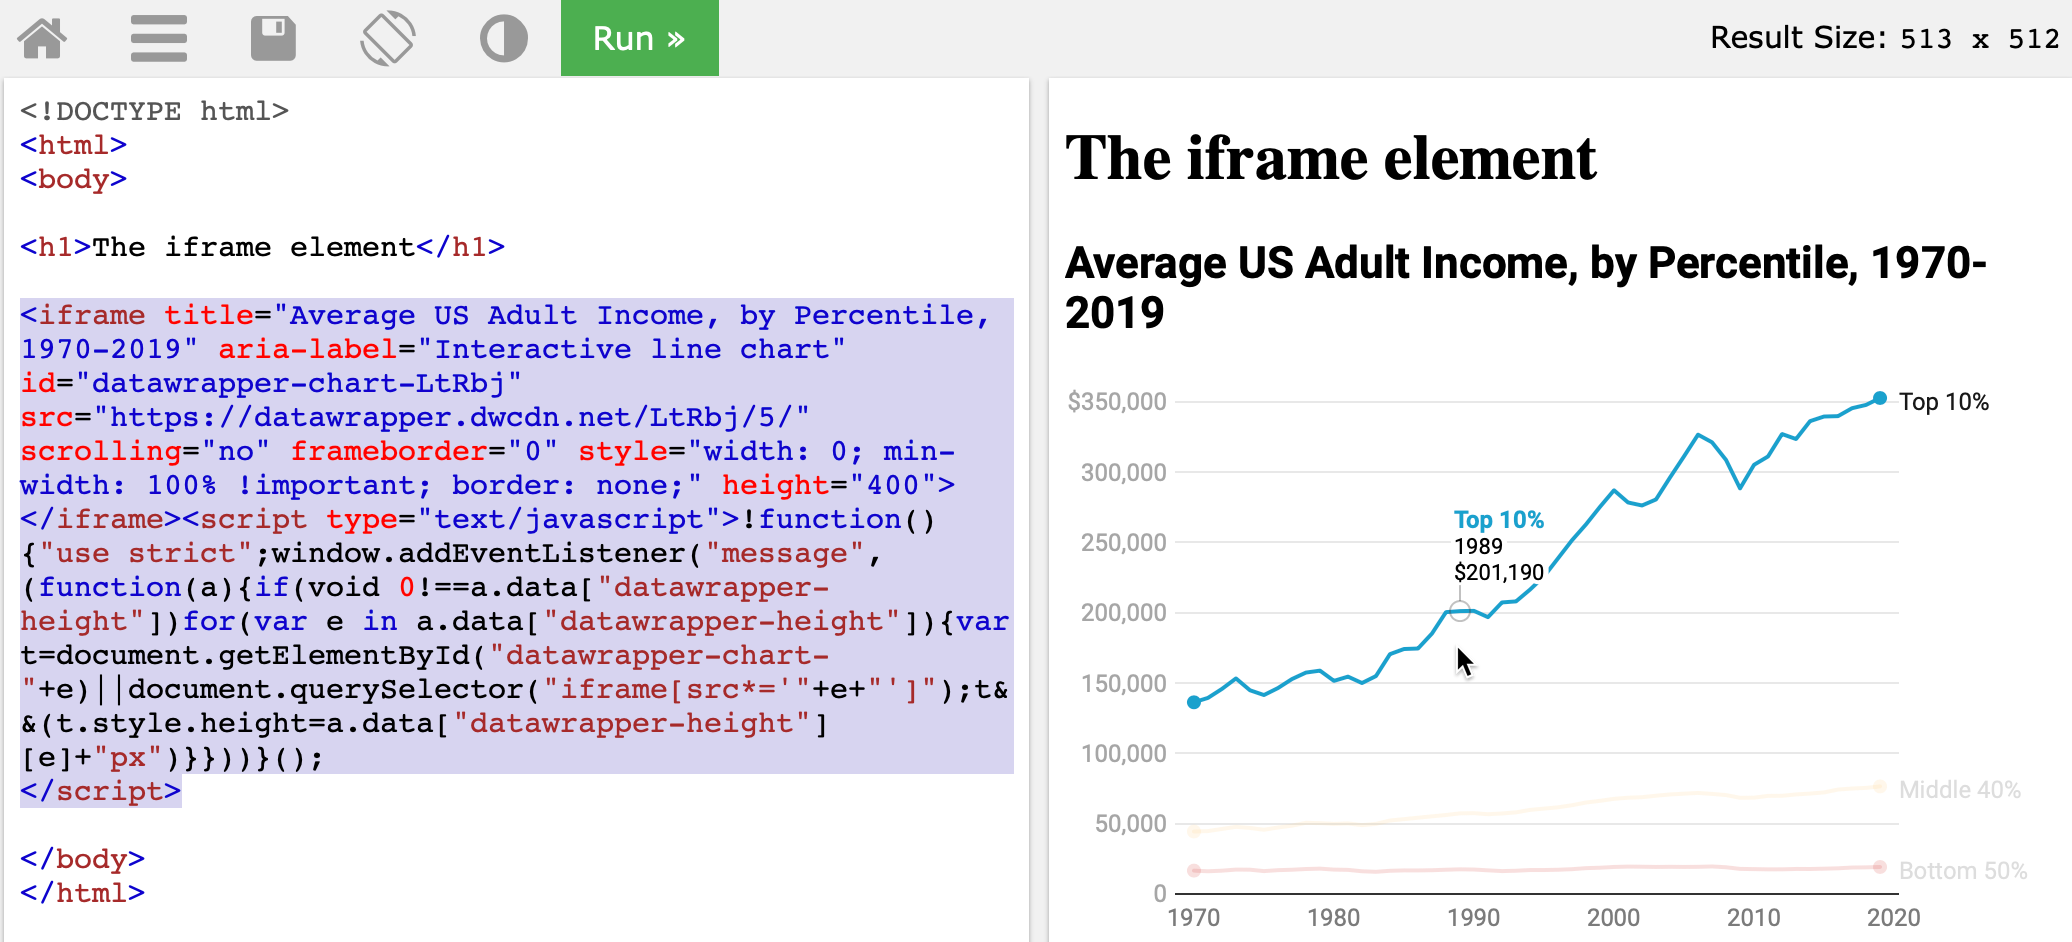
Figure 9.9: Paste your Datawrapper embed code in place of the current iframe tag in the TryIt page and click Run.
The Datawrapper embed code is long, but if you look closely, the first half contains a relatively straightforward iframe tag that includes familiar-looking attributes such src, scrolling, and frameborder, and width and height inside a style tag. The second half of the embed code contains JavaScript instructions to make the iframe appear responsive depending on the size of the device screen.
- Always try to paste the full embed code in your desired web platform. Jump to the paste code to website section of this chapter to learn how to properly insert your embed code into common websites.
Tip: But if it doesn’t work, go back to step 3 and experiment. Try to edit the embed code down to a simple iframe, and run it again to see how it looks, as shown in Figure 9.10. Sometimes a simple iframe works better on your website than a complex embed code.
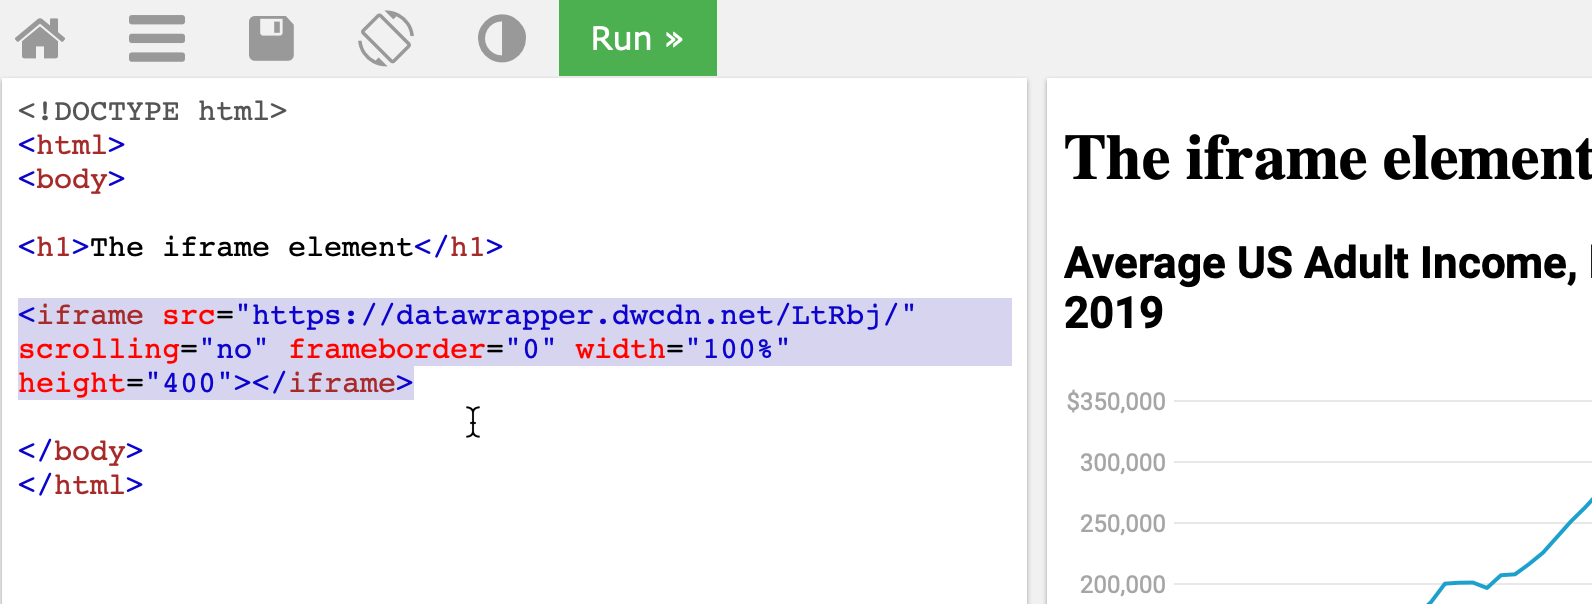
Figure 9.10: If a complex embed code does not work in your website, go back and try to edit it down into a simple iframe.
Tip: The Datawrapper iframe tag source follows this general format: https://datawrapper.dwcdn.net/abcdef/1/, where the 1 refers to the first version of the chart or map you published. If you make edits and re-publish your visualization, Datawrapper will increase the last digit (to 2 and so forth), and automatically redirect older links to the current version, which keeps your work up-to-date for your audience.
from Tableau Public
- After you create a Tableau Public chart in Chapter 6 or map in Chapter 7, publish your worksheet, dashboard, or story online by selecting File > Save to Tableau Public in the desktop application menu, as shown in Figure 9.11.
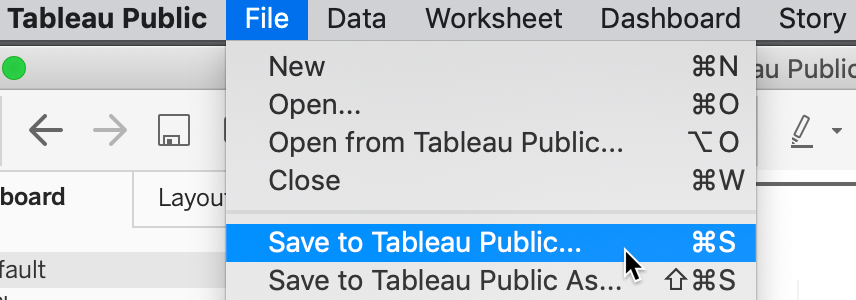
Figure 9.11: In the Tableau Public desktop application, select File–Save to Tableau Public to publish to the online server.
- In your online Tableau Public account profile page, click to View the details of any of your published visualizations, as shown in Figure 9.12.

Figure 9.12: In your Tableau Public online profile page, click to View the details of a published visualization.
Tip: All of your published visualizations appear under your username account profile on the Tableau Public server. If you don’t recall your username, search the Tableau Public server for your first and last name that you entered when creating your online account.
- When viewing details for a published visualization in your Tableau Public online account, scroll down and click on the Share symbol in the lower-right corner. Select and copy its embed code, as shown in Figure 9.13.

Figure 9.13: Scroll down in the online published visualization details, click the Share button, and copy the embed code.
- To better understand how the embed code works, open the W3Schools TryIt iframe page. Select the current iframe tag, paste in your embed code to replace it, and press the green Run button. The result should be similar to Figure 9.14, but instead will display your embed code and interactive visualization. Note how the Tableau Public embed code is so long that it does not fit in this image.
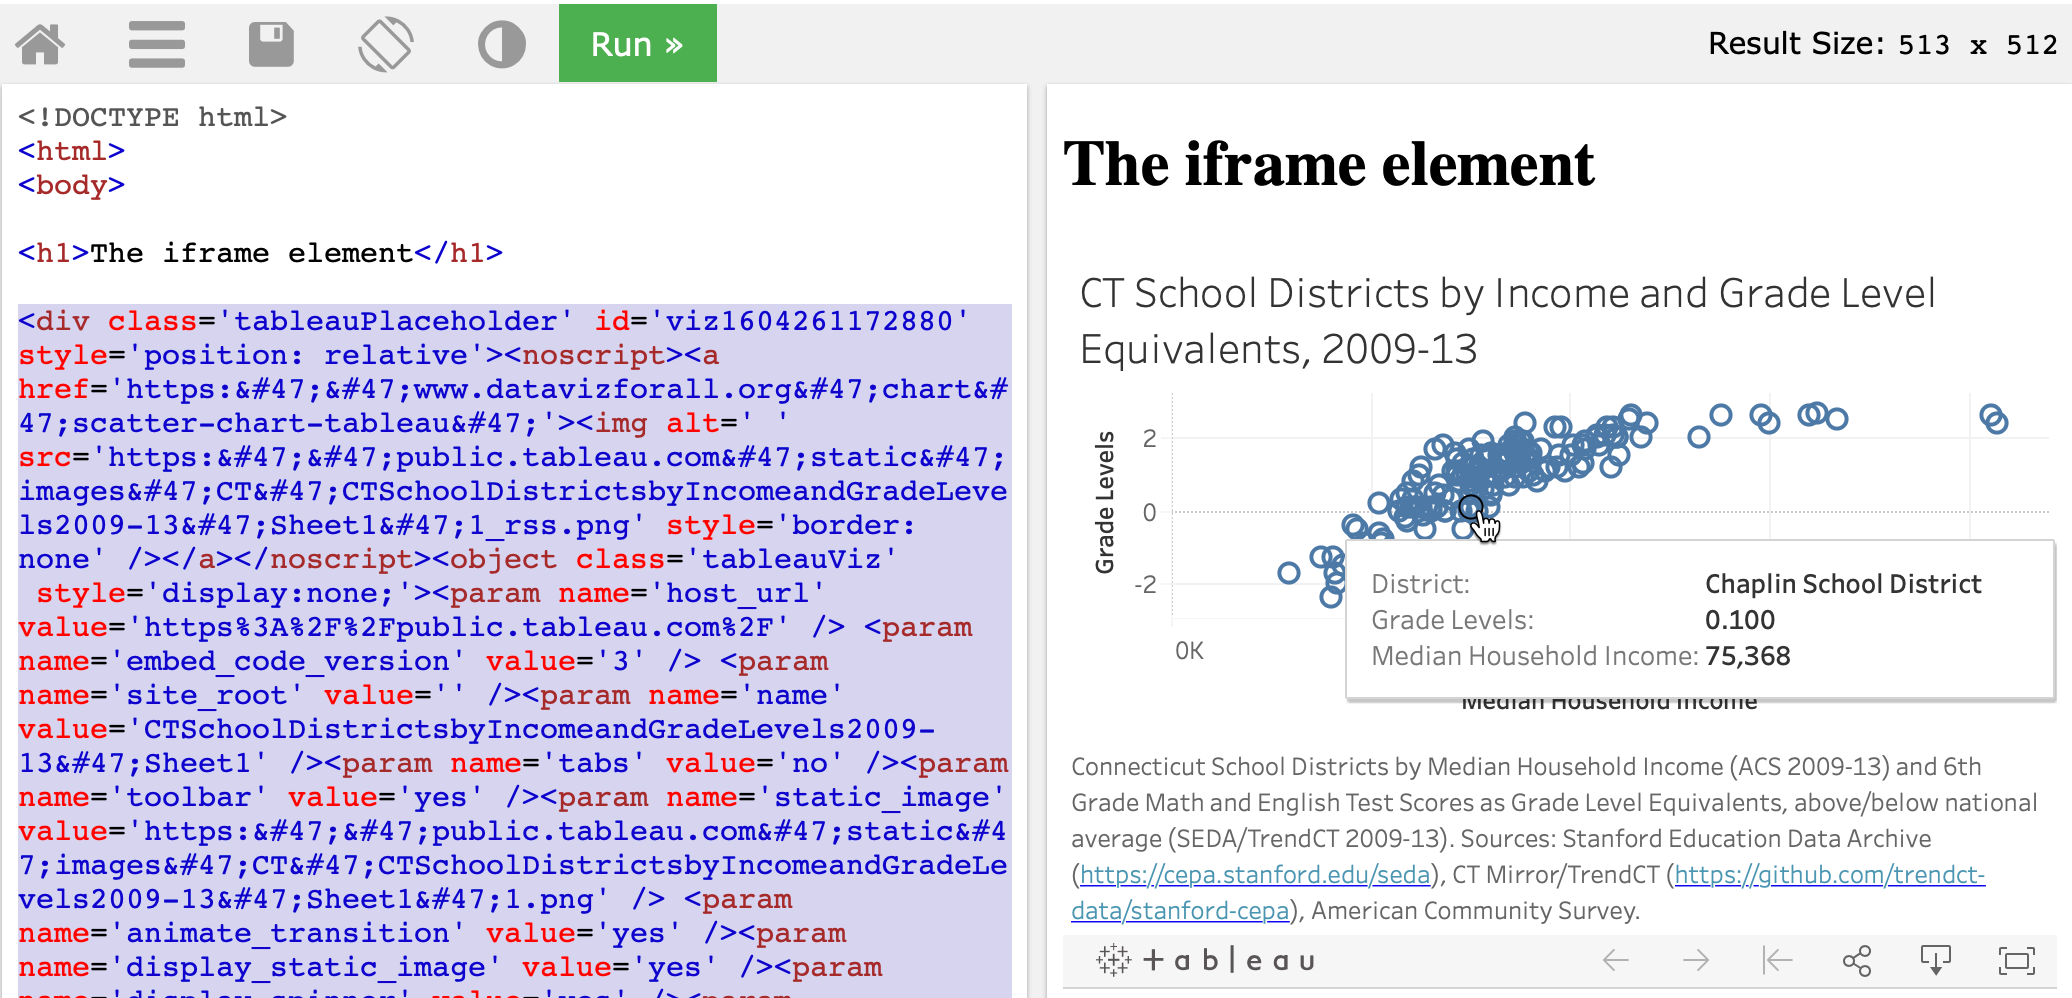
Figure 9.14: Paste your Tableau public embed code in place of the current iframe tag in the TryIt page and click Run.
- Always try to paste the full embed code in your desired web platform. Jump to the paste code to website section of this chapter to learn how to properly insert on different common websites.
However, if your web platform does not accept the full embed code for Tableau Public, the next strategy is to try to copy the Tableau Public link to your visualization and convert it into a simpler iframe tag, and see how it works in your website. Here’s how to copy and convert it.
- In your published visualization on your Tableau Public online account, scroll down and click on the Share symbol in the lower-right corner, as previously shown in Figure 9.13. But this time, select and copy its link, not the embed code. A typical link looks similar to this one:
https://public.tableau.com/views/CTSchoolDistrictsbyIncomeandGradeLevels2009-13/Sheet1?:language=en&:display_count=y&:origin=viz_share_link
- Paste the link into the W3Schools TryIt iframe page, and delete all of the code that appears after the question mark (
?), so that it looks like this:
https://public.tableau.com/views/CTSchoolDistrictsbyIncomeandGradeLevels2009-13/Sheet1?
- At the end, attach this code snippet to replace what you deleted above:
:showVizHome=no&:embed=true
- Now your edited link should look like this:
https://public.tableau.com/views/CTSchoolDistrictsbyIncomeandGradeLevels2009-13/Sheet1?:showVizHome=no&:embed=true
- Enclose your edit link inside an iframe source tag
src=with quotes, to make it look similar to this:
src="https://public.tableau.com/views/CTSchoolDistrictsbyIncomeandGradeLevels2009-13/Sheet1?:showVizHome=no&:embed=true"
- Add iframe start and end tags, and also attributes for
width,height,frameborder="0", andscrolling="no", to make it look similar to this:
<iframe src="https://public.tableau.com/views/CTSchoolDistrictsbyIncomeandGradeLevels2009-13/Sheet1?:showVizHome=no&:embed=true" width="90%" height="500" frameborder="0" scrolling="no"></iframe>
Tip: Insert width="90%", rather than 100%, to help readers to scroll more easily down your web page with a margin.
- Press Run to see how it looks in the W3Schools TryIt iframe page, as shown in Figure 9.15. Sometimes a simple iframe works better on your website than a complex embed code.
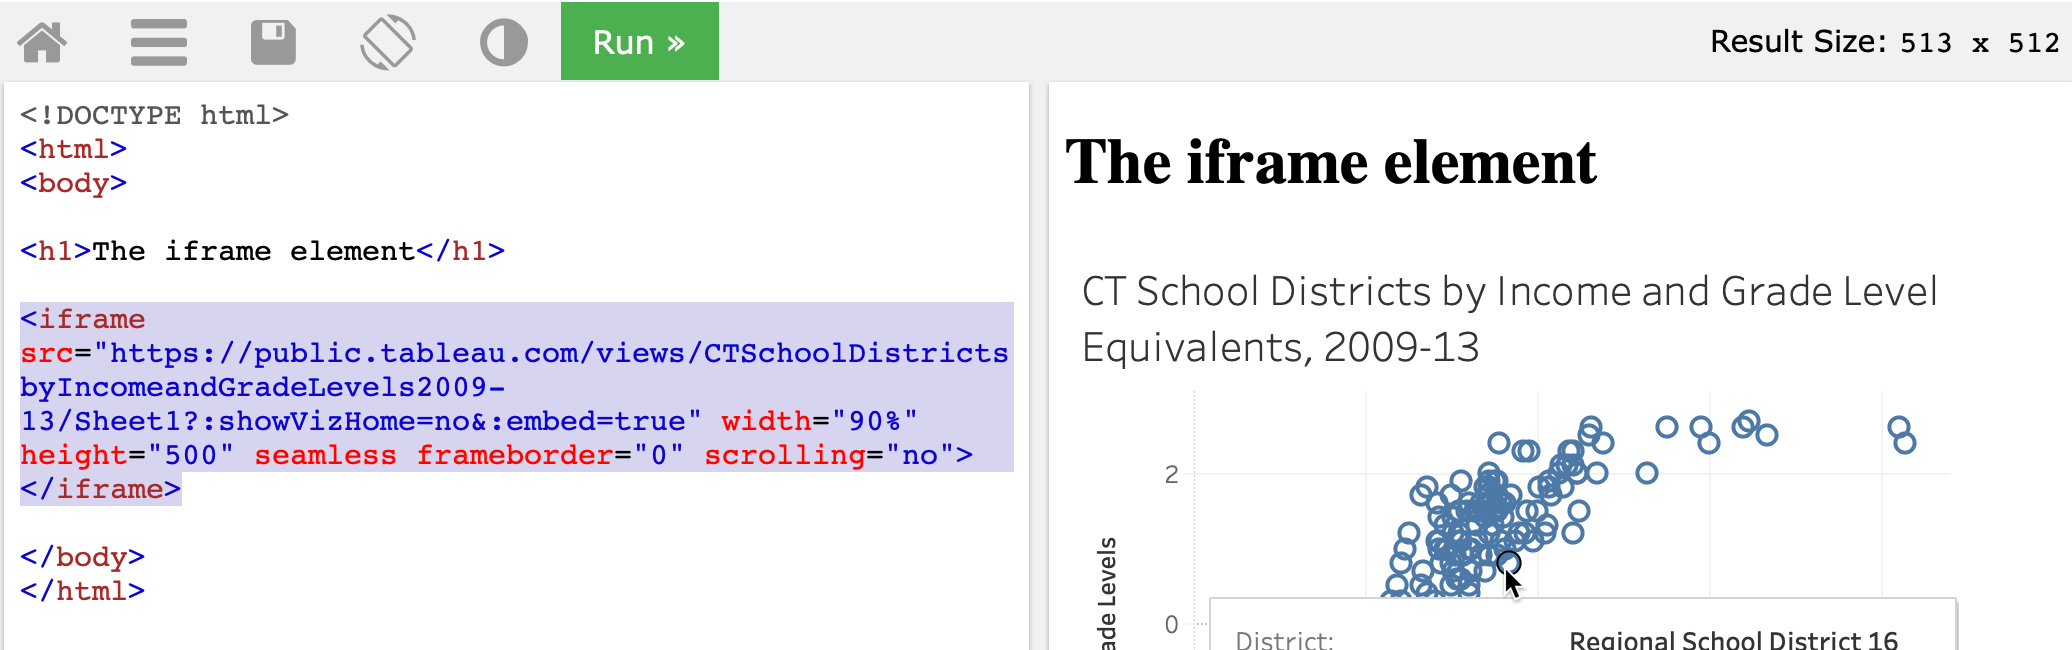
Figure 9.15: If a complex embed code does not work in your website, go back and copy the link to the visualization, and try to convert it into a simple iframe.
Learn more about how to embed an iframe on the Tableau Public support page.
Now that you have a better sense of how to copy embed codes, and edit them down to simpler iframes if needed, in the next section you’ll learn how to paste them into common websites to share your interactive visualizations with wider audiences.