#StandWithUkraine - Stop the Russian invasion
Join us and donate. We are contributing all book royalties from 2022 to present to:
Save Life in Ukraine and Ukraine Humanitarian Appeal.
Start Sketching Your Data Story
Before we dive into digital tools, let’s focus on what’s most important: our data story. We build visualizations to help us tell a story about the information we’ve gathered, a narrative that draws the audience’s attention to meaningful patterns and key insights amid all of the pieces of data. Help them to see the forest, rather than listing every single tree.
But in the early stage of a data visualization project, a common problem is that we don’t yet have a clear sense of the key pieces of our data story, or how they fit together. That’s perfectly normal. One of the best ways to address that problem is a quick exercise that’s designed to move partially-formed ideas from inside our heads out onto pieces of paper, to help you and any co-workers see them more clearly.
For this exercise, push away your computer and pick up some of our favorite old-school tools:
- several blank sheets of paper
- colored pencils, pens, or markers
- your imagination
Get ready to sketch out your data story in words and pictures. No artistic skills are required.
On the first sheet of paper, write down the problem that motivates your data project. If you prefer a prompt, try filling in these blanks: We need to find out ______ in order to _________. In many cases, people come to data visualization with an information-driven problem, which they hope will lead them to achieve a broader goal. For example, when working on the first draft of this book, our problem statement was: We need to find out our readers’ backgrounds and interests about data visualization, in order to write a better introductory guide that meets their needs.
On the second sheet of paper, rewrite your problem statement into a question. Write a question for which you genuinely do not yet know the answer—and punctuate it with a question mark. If your brain is tempted to jump ahead and try to answer the question, fight that urge. Instead, focus on framing the question, by using more precise wording than what you wrote above, without limiting the range of possible results. For example, when working on the first draft, our question was: How do readers of our book describe their prior experience with data visualization, education level, and learning goals? While we had some preliminary guesses, we honestly didn’t know the answer at that stage, which made it an authentic question.
On the third sheet of paper, draw pictures and arrows to show how you’ll find data to answer your question above. Are you conducting door-to-door interviews with neighborhood residents, or sending an online survey to customers, or downloading family income and county maps from the US Census? Sketch a picture of your data collection process, to show how you plan to bring together different pieces of information. For example, when writing the first draft of our book, we asked readers to fill out a quick online survey form, and reminded them not to insert any private data, because we shared back their collected responses in a public spreadsheet.
On the fourth sheet of paper, sketch at least one type of visualization you plan to create after you obtain your data above. Do you envision some type of chart, like a bar, line, or scatter chart? Or do you imagine some type of map, maybe with points or polygons? If your visualizations will be interactive, try to show the concept using buttons and more than one sheet of paper. You can add imaginary data at this stage because it’s just a preliminary sketch, as shown in Figure 1.1. Have fun!
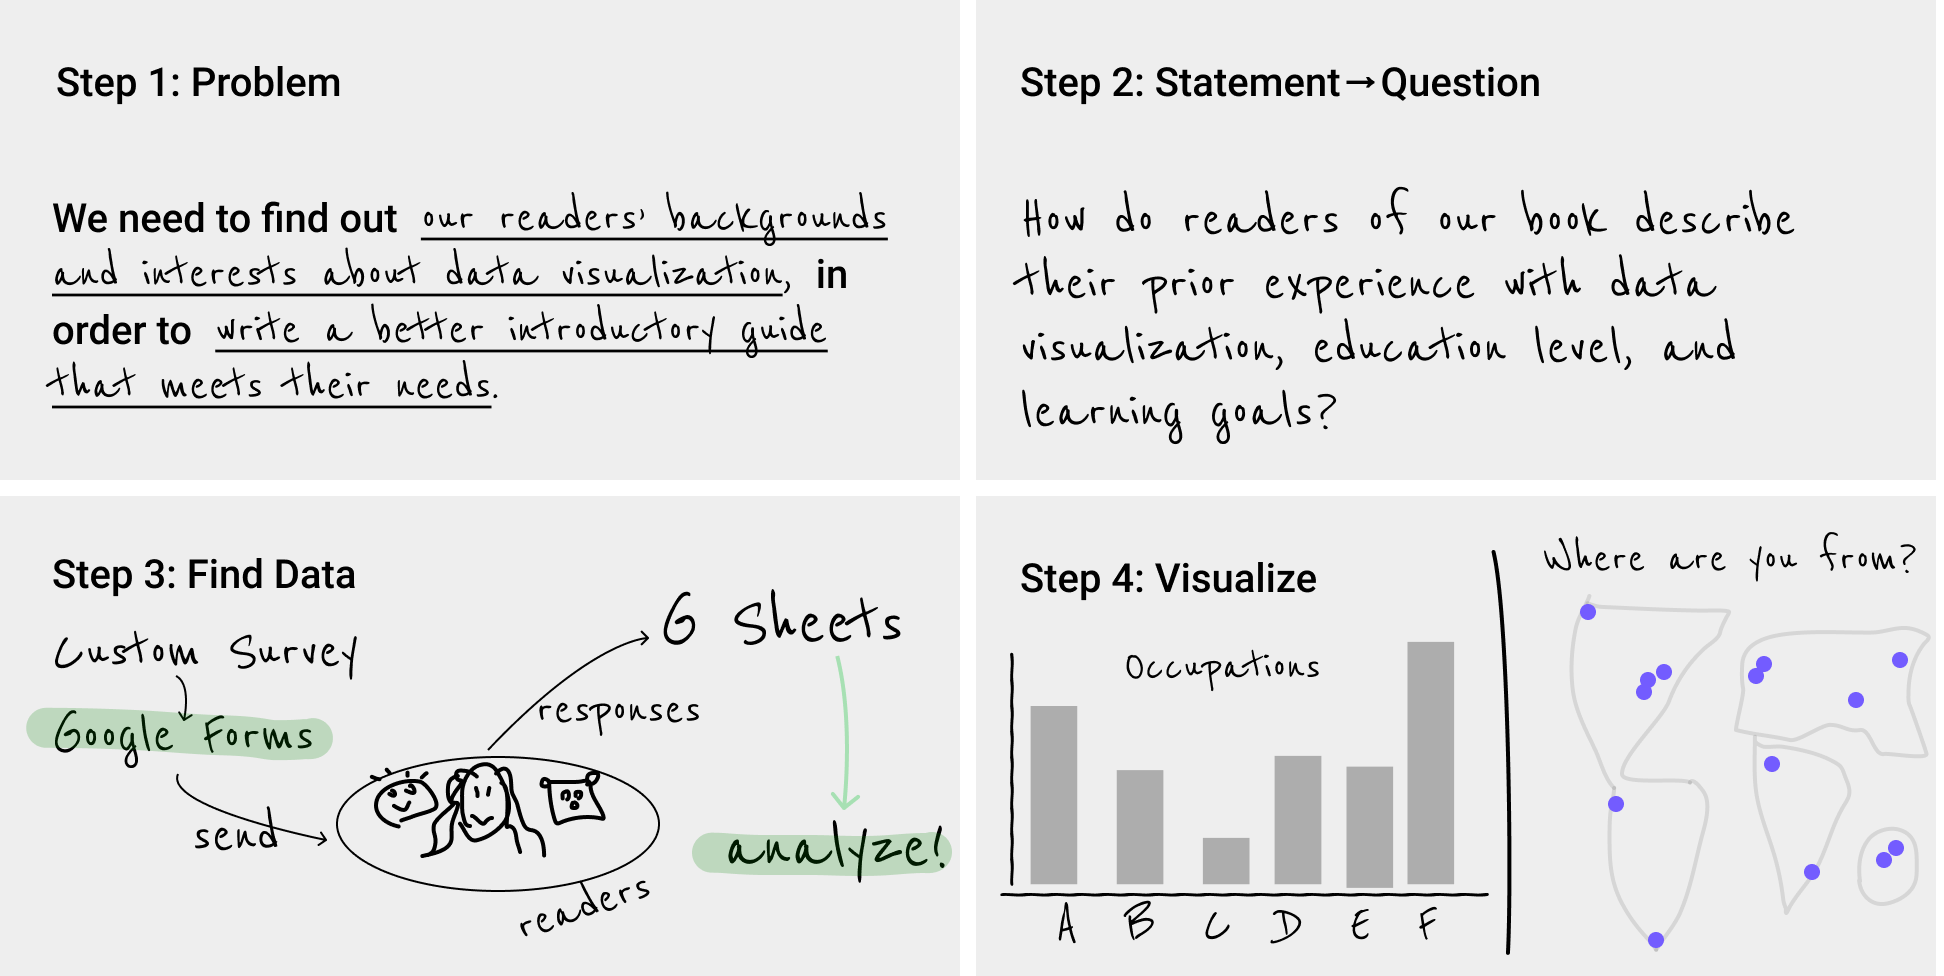
Figure 1.1: Sketch out your story idea on four pages: problem, question, find data, visualize.
This exercise can help you in multiple ways, whether you do it by yourself, or even better, with a team of co-workers, as shown in Figure 1.2. First, by migrating ideas from your mind to paper, you’ll make your thinking clearer not only for you, but also more visible for others. When ideas are sketched out, you can reflect on them, listen to feedback, cross-out not-so-good ones, and replace them with better ones on new sheets of paper. If your initial sketches are too complicated or confusing, break down those ideas into separate pages to make them more coherent.

Figure 1.2: The data story sketching exercise can be done solo, but works even better with a team of people. In our data visualization course, college students and community partners collaborate on framing the data story for their projects.
Second, look at your sheets like a storyboard. Spread them out on a table, move them around to potentially reorder the sequence, start to define the three essential stages of your story: the beginning, middle, and end. Also, these pages can help you organize your thinking about how you’ll communicate your data story to larger audiences, such as a presentation slide deck, or paragraphs and pictures for your next report or web page. Don’t throw them away, because we’ll return to this exercise at the end of the book in Chapter 15: Tell and Show Your Data Story.
Finally, this sketching exercise can help you identify which chapters you should focus on in the body of this book. If you’re puzzled about where to search for data, check out Chapter 3: Find and Question Your Data. If you’re thinking about building a chart or map, but need examples of different types, look at the beginning of Chapter 6: Chart Your Data and Chapter 7: Map Your Data.
Now that you have a clearer sense of the story you wish to tell, and some initial ideas about the visualizations you wish to create, in the next two sections we’ll discuss tools to do the job, and factors you should consider when deciding among them.